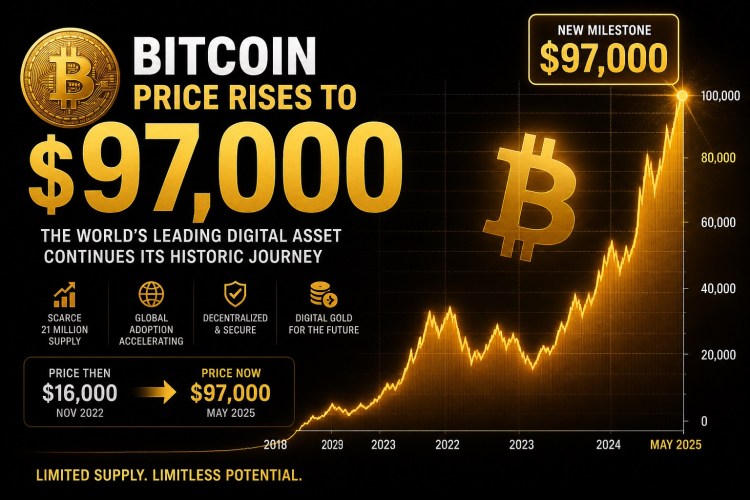
Bitcoin Price Expansion To $97,000 Is Only Being Blocked By One Pesky Retest
Analysis
Price Impact
HighThe article suggests a significant price expansion for bitcoin to $97,000, which is a substantial upward movement. however, it also highlights a necessary retest of a key support level, introducing a potential short-term pullback before the major move.
Trustworthiness
MedPrice Direction
BullishThe article indicates a bullish short-term structure with momentum building and trendline support holding. the breakout above a descending resistance line is a strong bullish signal, with the potential target set at $97,400, contingent on a successful retest of the demand zone.
Time Effect
ShortThe immediate focus is on a potential retest of the $71,900-$72,000 level, which is a short-term price action event. while the target is a significant expansion, the required retest is a near-term consideration.
Original Article:
Article Content:
Reason to trust Strict editorial policy that focuses on accuracy, relevance, and impartiality Created by industry experts and meticulously reviewed The highest standards in reporting and publishing How Our News is Made Strict editorial policy that focuses on accuracy, relevance, and impartiality Ad discliamer Morbi pretium leo et nisl aliquam mollis. Quisque arcu lorem, ultricies quis pellentesque nec, ullamcorper eu odio. The latest Bitcoin move has brought bulls back into control of the short-term chart, but the setup is not as straightforward as a clean breakout into higher prices. The 4-hour structure shows momentum building, trendline support holding, and buyers pushing through to higher highs. However, the path to a much larger expansion still appears to have one unfinished step. The technical chart implies Bitcoin may need to revisit an important area before the next major move to at least $97,000 can develop properly. Bitcoin Breakout Leaves One Important Level Behind Technical analysis of Bitcoin’s price action on the 4-hour candlestick chart posted on the TradingView platform shows the leading cryptocurrency is already doing the difficult part of the setup. Related Reading If You Hold XRP, Then You Should Be Paying Attention To These Major Developments 3 days ago Bitcoin’s price action has moved above the long descending resistance line that had stopped previous rallies, turning the broader 4-hour structure more bullish. The breakout also came while Bitcoin continued to respect the rising support trendline that has guided the recovery since late February to April. However, breakouts without retests are incomplete. The 4-hour chart also shows that the Bitcoin price has moved ahead of the strongest demand zone, leaving behind the $71,900 to $72,000 region as the area bears may still want to retest. Bitcoin Price Chart. Source: TradingView The Expansion Phase And What It Requires The most important part of the setup is the support region around $71,900 to $72,000. However, a retest of this range would not be a sign of weakness. It would be the price action doing precisely what it is supposed to do: return to a level of proven demand and absorb remaining sell orders, create a strong buying opportunity, and establish a foundation solid enough to support an expansion to new yearly highs. Speaking of a run to new yearly highs, the price target proposed by this analysis is a rally to at least $97,400. This means the bullish setup has some room to breathe, but not unlimited room. Related Reading Here’s How The Ethereum Vs. Solana Rivalry Is Going 5 days ago There is an invalidation level sitting at $67,500. A breakdown below $67,500 would weaken the argument that Bitcoin is only retesting before expansion. Instead, it would mean that the breakout has failed and that sellers have regained control of the short-term structure. The broader market backdrop is helping the bullish case. Bitcoin’s rebound has coincided with heavy demand through US Spot Bitcoin ETFs, which witnessed $630 million in inflows on May 1. Bitcoin briefly broke above $80,000 over the weekend, but the move failed to hold as the price reversed before the daily close. A daily close above $80,000 could serve as the first signal of a broader bullish expansion. BTC 200 Day Moving Average The next major confirmation would be a daily close above the 200-day moving average, which is currently at $83,600. Bitcoin has not closed above this moving average since October 2025, making it an important level for bulls to reclaim. BTC bears push down price | Source: BTCUSD on Tradingview.com Featured image created with Dall.E, chart from Tradingview.com