XRP Price Upside Rejected, Momentum Shifts Back to Sellers
Analysis
Price Impact
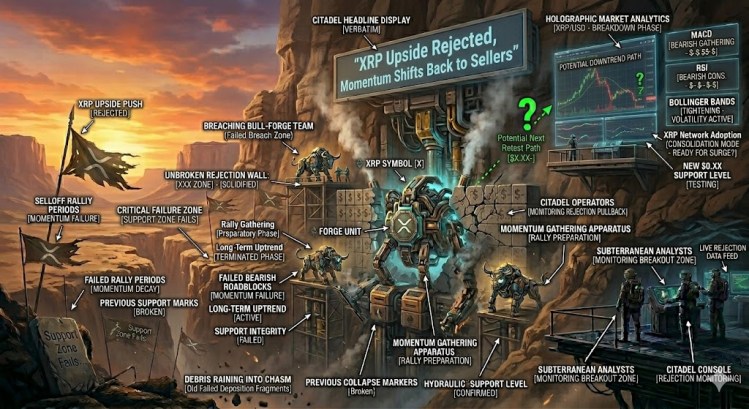
MedThe article suggests that xrp's upside momentum has been rejected and momentum is shifting back to sellers, with key support and resistance levels highlighted. this indicates a potential short-term price reversal or consolidation. the mention of consolidation above $1.3500 and the 100-hourly sma provides some bullish undertone, but the overall sentiment is cautious.
Trustworthiness
HighPrice Direction
NeutralThe price is currently consolidating between key support ($1.3500) and resistance ($1.3680, $1.3780) levels. while there's a possibility of another increase if it stays above $1.3500, the momentum has shifted back to sellers, and a break below $1.3500 could lead to further declines. this indicates a neutral short-term outlook with potential for both upward and downward movement depending on which level breaks.
Time Effect
ShortThe analysis focuses on hourly charts and immediate price action, mentioning 'hourly simple moving average' and 'hourly chart', indicating that the analysis is primarily for short-term trading decisions.
Original Article:
Article Content:
Reason to trust Strict editorial policy that focuses on accuracy, relevance, and impartiality Created by industry experts and meticulously reviewed The highest standards in reporting and publishing How Our News is Made Strict editorial policy that focuses on accuracy, relevance, and impartiality Ad discliamer Morbi pretium leo et nisl aliquam mollis. Quisque arcu lorem, ultricies quis pellentesque nec, ullamcorper eu odio. XRP price started a downside correction from the $1.40 zone. The price is now consolidating and might aim for another increase if it stays above the $1.350 zone. XRP price started a downside correction after it failed to clear the $1.40 zone. The price is now trading above $1.350 and the 100-hourly Simple Moving Average. There is a bullish trend line forming with support at $1.3490 on the hourly chart of the XRP/USD pair (data source from Kraken). The pair could start a fresh increase if it settles above $1.3780. XRP Price Dips Again XRP price started a decent upward move above $1.3550 and $1.3650, like Bitcoin and Ethereum . The price gained pace for a clear move above the $1.380 resistance. A high was formed at $1.3964, and the price started a downside correction. There was a move below $1.3680 and $1.360. The price dipped below the 50% Fib retracement level of the upward move from the $1.320 swing low to the $1.3964 high. The price is now trading above $1.350 and the 100-hourly Simple Moving Average. There is also a bullish trend line forming with support at $1.3490 on the hourly chart of the XRP/USD pair. Source: XRPUSD on TradingView.com If there is a fresh upward move, the price might face resistance near the $1.3680 level. The first major resistance is near the $1.3780 level, above which the price could rise and test $1.3880. A clear move above the $1.3880 resistance might send the price toward the $1.40 resistance. Any more gains might send the price toward the $1.4120 resistance. The next major hurdle for the bulls might be near $1.4250. Another Drop? If XRP fails to clear the $1.3680 resistance zone, it could start a fresh decline. Initial support on the downside is near the $1.3550 level. The next major support is near the $1.350 level and the trend line or the 61.8% Fib retracement level of the upward move from the $1.320 swing low to the $1.3964 high. If there is a downside break and a close below the $1.350 level, the price might continue to decline toward $1.3380. The next major support sits near the $1.320 zone, below which the price could continue lower toward $1.30. Any more losses might call for a test of $1.2880. Technical Indicators Hourly MACD – The MACD for XRP/USD is now gaining pace in the bearish zone. Hourly RSI (Relative Strength Index) – The RSI for XRP/USD is now below the 50 level. Major Support Levels – $1.3500 and $1.3380. Major Resistance Levels – $1.3680 and $1.3780.