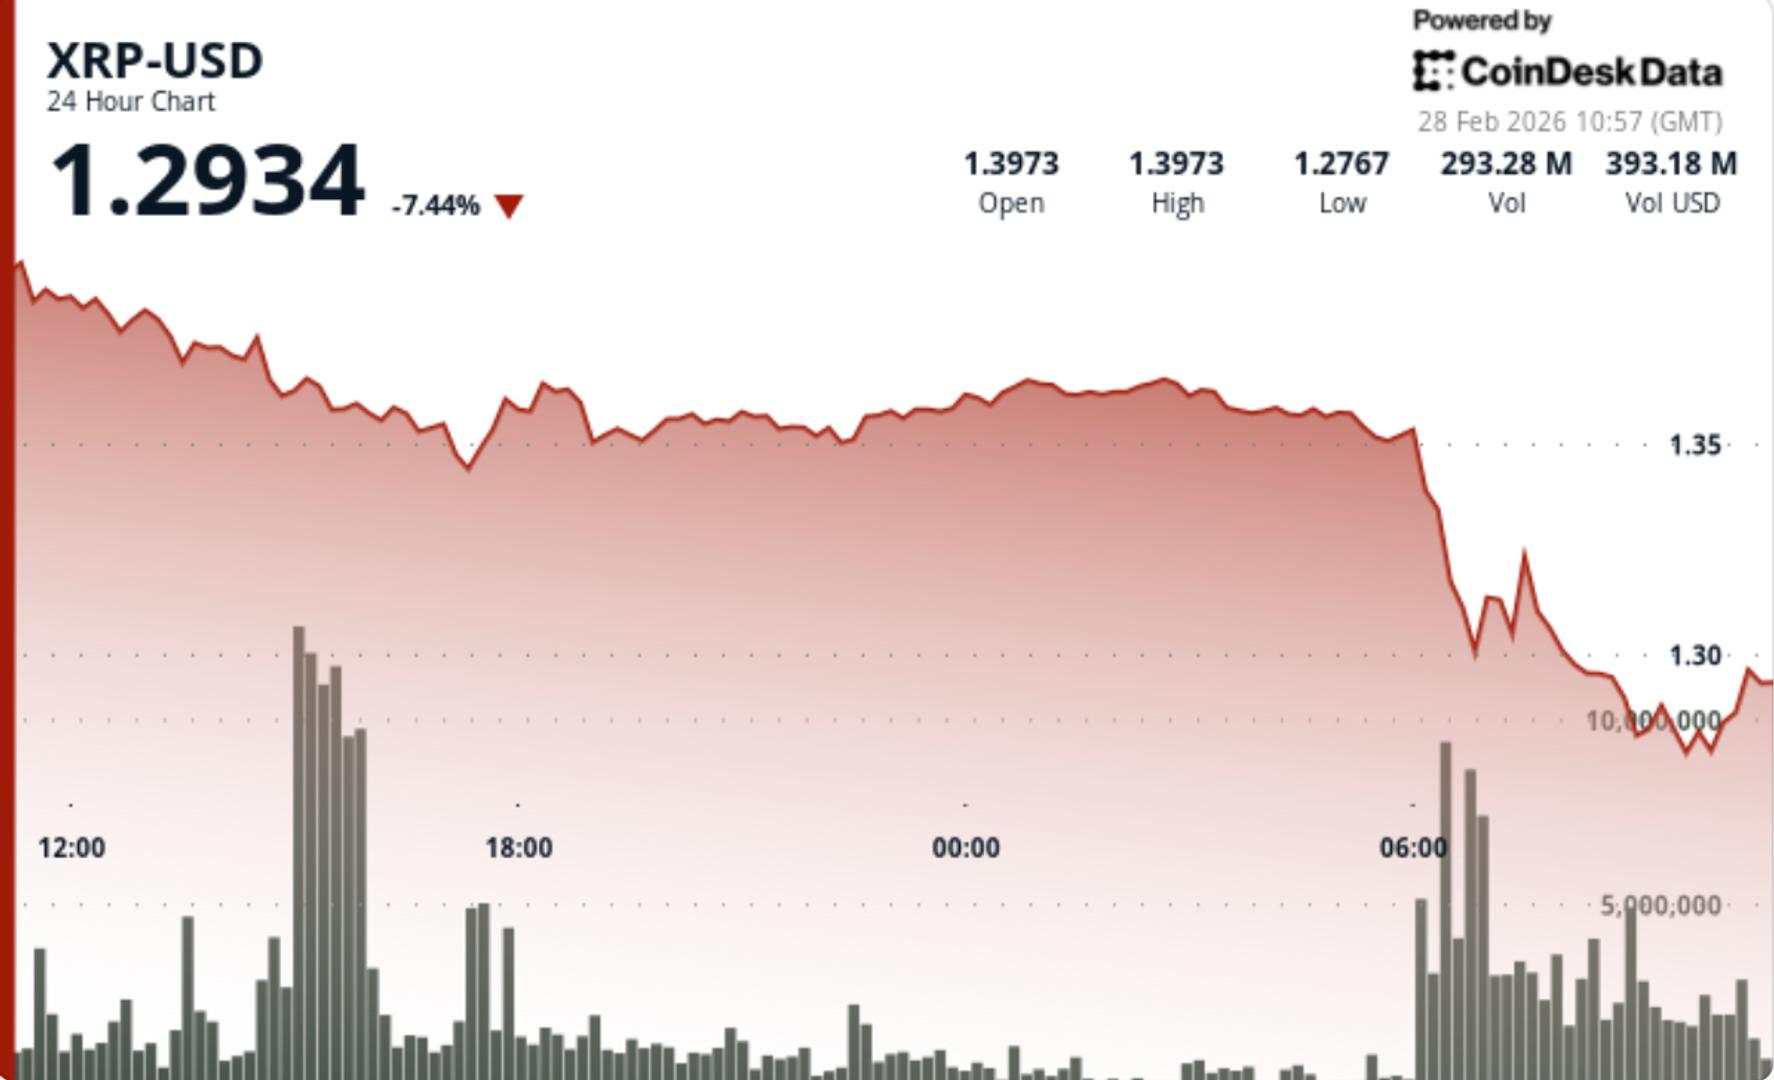
XRP tumbles 9% as break below $1.36 wipes out relief rally
Analysis
Price Impact
HighXrp experienced a significant 9% price drop, breaking below a key support level ($1.36) on heavy volume, indicating strong selling pressure and a bearish shift in market sentiment. the failure to sustain a rebound further confirms this weakness.
Trustworthiness
HighThe analysis is based on specific price action, volume data (170% above average during capitulation), and technical indicators (lower highs, resistance levels). the narrative clearly outlines the technical breakdown and its implications.
Price Direction
BearishThe price has broken below critical support at $1.36, with former support now acting as resistance. a decisive break below $1.30 could lead to further downside towards $1.20-$1.22. any bounces are considered corrective until key resistance levels are reclaimed.
Time Effect
ShortThe immediate focus is on whether the $1.30 support level holds in the short term. further downside is anticipated if this level fails, suggesting an ongoing short-term bearish trend.
Original Article:
Article Content:
Markets Share Share this article Copy link X icon X (Twitter) LinkedIn Facebook Email XRP tumbles 9% as break below $1.36 wipes out relief rally Traders are watching $1.30 as immediate support after heavy-volume selling confirmed a bearish shift. By Shaurya Malwa Feb 28, 2026, 1:30 p.m. Make us preferred on Google What to know : XRP slid 9.1 percent from $1.42 to $1.30 after a high-volume breakdown below the key $1.36 support level, signaling intensified selling pressure. The failed rebound and swift rejection near $1.32–$1.33 confirmed a pattern of lower highs, with former support at $1.36–$1.37 now acting as resistance. Traders are watching whether $1.30 can hold as a near-term floor, as a decisive break lower could open downside toward $1.20–$1.22 while any bounce is viewed as corrective. XRP reversed sharply after failing to sustain its rebound, with a high-volume breakdown through $1.36 accelerating downside momentum. News Background XRP fell alongside renewed weakness across the broader crypto market, but the decisive move was technical rather than headline-driven. The token had staged a brief relief rally earlier in the week, only to stall below key resistance and roll over as sellers defended higher levels. The breakdown extends XRP’s corrective pattern since its July 2025 peak, reinforcing a sequence of lower highs and failed recovery attempts. Price Action Summary XRP dropped 9.1% from $1.42 to $1.30 Selling intensified once $1.36 support failed Volume surged more than 170% above average during the main capitulation phase A brief rebound toward $1.33 was quickly rejected Technical Analysis The critical event was the clean break below $1.36, which had served as near-term structural support. Once lost, downside momentum accelerated, driving price toward $1.30 on outsized volume — a sign of forced selling rather than gradual distribution. A short-covering bounce pushed XRP to $1.325, but the rally stalled immediately, forming a clear lower high and confirming the broader downtrend remains intact. Former support at $1.36–$1.37 now acts as resistance, while $1.32–$1.33 caps near-term recovery attempts. On higher timeframes, XRP remains below key retracement levels, with $1.47 representing the next meaningful structural hurdle should buyers regain control. What traders say is next? Traders are focused on whether $1.30 can hold as a near-term floor. If $1.30 stabilizes, XRP may consolidate before attempting another push toward $1.32–$1.36. A reclaim of $1.36 would be the first sign that the breakdown was overextended. If $1.30 fails decisively, downside risk shifts toward the $1.20–$1.22 region, where longer-term demand is expected to emerge. For now, momentum favors sellers, and any bounce is viewed as corrective until resistance levels are reclaimed. More For You Bitcoin's five-month slide: why BTC is set for worst losing streak since 2018 By Olivier Acuna , James Van Straten | Edited by Jamie Crawley , Stephen Alpher 31 minutes ago With BTC down nearly 50% from its peak, analysts are sparring over whether the slump marks early repricing or signals more pain to come. What to know : Bitcoin is on pace for a fifth straight monthly loss, its worst such streak since 2018. Analysts say the slump reflects a broader "structural regime shift" in how markets price risk, as bitcoin underperforms resilient U.S. stocks, lags gold and sees volatile correlations with equities. Some market watchers warn the current 52% drawdown could deepen toward past bear-market declines, while others argue deeply negative sentiment and ongoing accumulation may set the stage for a sharp reversal if key resistance levels are reclaimed. Read full story Latest Crypto News Bitcoin's five-month slide: why BTC is set for worst losing streak since 2018 31 minutes ago Bitcoin sets up potential short squeeze as funding plunges to -6% 2 hours ago Bitcoin could see further downside risks as Iran attacks U.S. bases across Middle East 3 hours ago Oil-linked futures on Hyperliquid surge 5% after U.S.-Israel strike on Iran 3 hours ago Bitcoin nears $63,000 as U.S. and Israel launch strikes on Iran 6 hours ago Bitcoin slides to $65,000 in weekend sell-off, with solana, XRP, dogecoin down 6% 9 hours ago Top Stories AI tool catches critical XRP Ledger bug that could have drained wallets Feb 27, 2026 U.S. Senate Democrats asked Treasury, DOJ to probe Binance's illicit finance controls 15 hours ago Vitalik Buterin reveals his bold new plan to fix Ethereum’s scaling problem 20 hours ago Citi and Morgan Stanley expand bitcoin and crypto custody, trading and tokenization efforts 18 hours ago Bitcoin ETF holders and treasury firms stack protection against price crash below $60,000, Deribit says Feb 27, 2026 The worst may lie ahead. Bitcoin chart revisits historic pattern. Feb 27, 2026