Bitcoin is the third most oversold ever, says one indicator, and violent upside could be next
Analysis
Price Impact
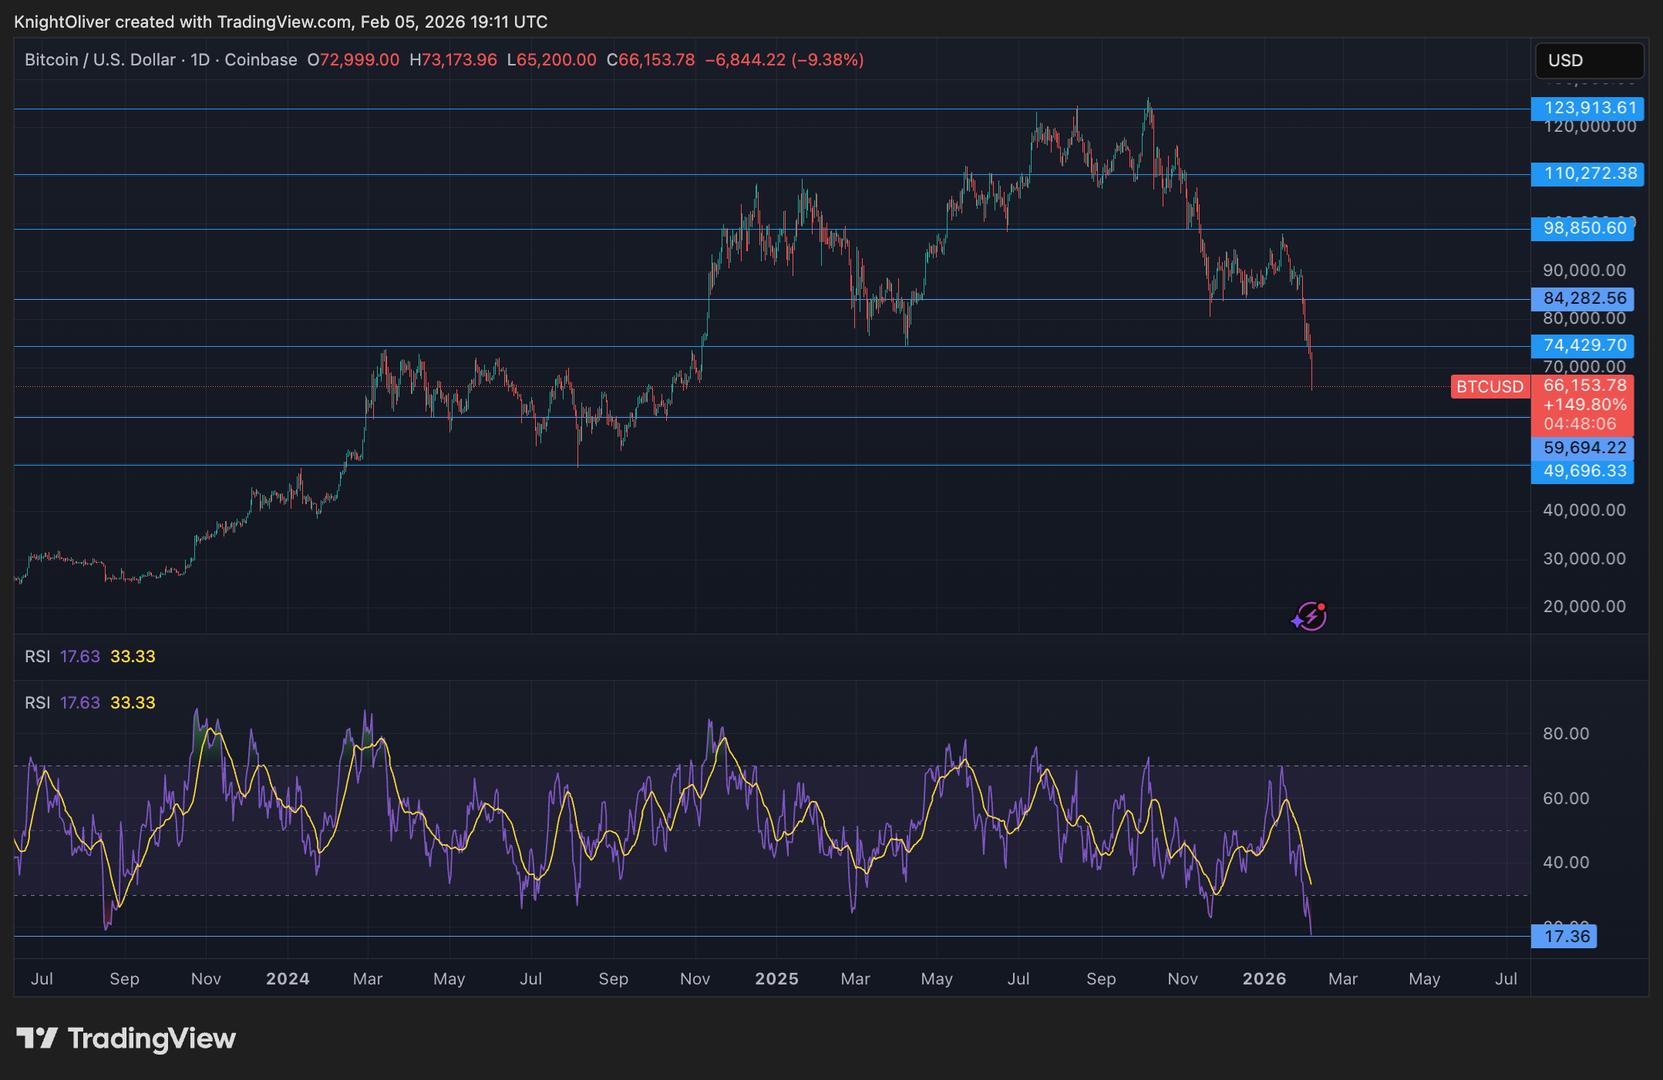
HighBitcoin's daily rsi has plunged to 17, a level historically seen only during major bear market bottoms (2018) and significant crashes (2020 covid). both prior instances led to 'violent upside' and 'multi-bagger moves' for btc.
Trustworthiness
HighThe analysis uses the relative strength index (rsi), a widely recognized technical indicator, and cites historical data from reputable sources like tradingview. coindesk is also a well-established crypto news outlet.
Price Direction
BullishThe extreme oversold condition indicated by the rsi (17.6) strongly suggests a potential reversal and significant upside. historical precedents show substantial rallies following similar low rsi readings.
Time Effect
LongPast instances of such extreme oversold rsi readings (2018 and 2020) resulted in price recoveries that extended over several months to over a year, indicating a long-term bullish trend rather than just a short-term bounce.
Original Article:
Article Content:
Markets Share Share this article Copy link X icon X (Twitter) LinkedIn Facebook Email Bitcoin is the third most oversold ever, says one indicator, and violent upside could be next The Relative Strength Index (RSI), a popular technical trading indicator, has plunged to 17. Only the bear market bottom in 2018 and the 2020 Covid crash saw lower reads. By Oliver Knight | Edited by Stephen Alpher Feb 5, 2026, 7:34 p.m. Make us preferred on Google Bitcoin's RSI has only been lower on two previous occasions (TradingView) What to know : Bitcoin's RSI has fallen to 17 amid the panic selling of the past few weeks. That sort of oversold reading has only been exceeded twice in bitcoin's modern history — the 2018 bear market bottom and the 2020 Covid crash. On each of those occasions, BTC rewarded investor with multi-bagger moves in the months that followed. Bitcoin tumbled to around $65,000 on Thursday amid a wave of liquidations driven by heavily bearish sentiment, but one technical indicator suggests the cryptocurrency could be set for not just a bounce, but a major move higher. Bitcoin's daily Relative Strength Index (RSI), which is a popularly used momentum oscillator that assesses whether an asset is oversold or overbought, flashed 17.6 (on a scale of 0-100) on Thursday — heavily oversold conditions that were topped in the modern BTC era by the Covid crash in 2020, when it fell to 15.6, and the 2018 market bottom, when it dropped to 9.5. STORY CONTINUES BELOW Don't miss another story. Subscribe to the Crypto Daybook Americas Newsletter today . See all newsletters Sign me up By signing up, you will receive emails about CoinDesk products and you agree to our terms & conditions and privacy policy . On both of those previous occasions, bitcoin rewarded buyers with violent upside moves. In 2018, BTC more than quadrupled over the ensuing 8 months from $3,150 to $13,800. In 2020, bitcoin soared from $3,900 to a cycle high of $65,000 just more than one year later. Thursday's market carnage liquidated more than $1.5 billion across crypto derivatives. While the temptation might be to sell when an asset is weak, astute traders will see the oversold territories as an opportunity — especially as liquidity between $70,000 and $80,000 has effectively been wiped out. Bitcoin News