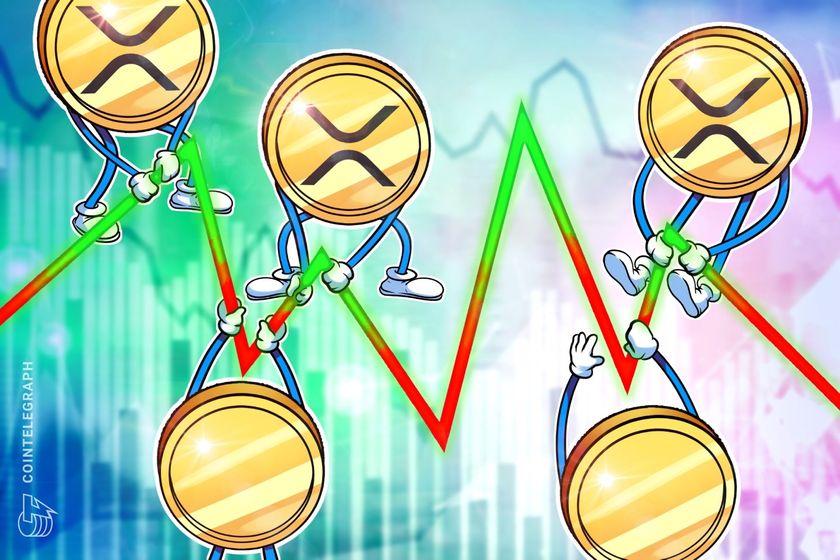
XRP price risks another 20% drop after 'Digital Asset Stockpile' letdown
Analysis
Price Impact
HighTechnical analysis suggests a potential 20% drop due to a symmetrical triangle formation and historical patterns. furthermore, the us government's clarification on its 'digital asset stockpile' and lack of xrp inclusion adds to the bearish sentiment.
Trustworthiness
HighThe analysis is based on technical chart patterns, historical data, and news from cointelegraph and twitter.
Price Direction
BearishThe symmetrical triangle pattern on the weekly chart points to a potential breakdown. negative news regarding xrp's exclusion from the us strategic crypto reserve reinforces the bearish outlook. declining whale holdings further support the downward trend.
Time Effect
ShortThe analysis focuses on near-term prospects, citing immediate technical pressures and recent news events, suggesting the price decline could occur in the coming weeks or months.
Original Article:
Article Content:
Yashu Gola 3 minutes ago XRP price risks another 20% drop after 'Digital Asset Stockpile' letdown A classic technical setup and the US government’s commitment to only selling altcoins from its new Digital Asset Stockpile are posing a threat to XRP's uptrend prospects. 16 Total views Listen to article 0:00 Altcoin Watch COINTELEGRAPH IN YOUR SOCIAL FEED Follow our Subscribe on As of March 8, XRP ( XRP ) faces mounting technical and fundamental pressures that suggest a possible 20% price decline in the near future. Drawing from recent market analyses and historical patterns, investors should watch three key signals. XRP price chart hints at 20% drop ahead XRP/USD is currently forming a symmetrical triangle on its weekly chart, a pattern reflecting a tug-of-war between buyers and sellers. XRP/USD weekly price chart. Source: TradingView Contrary to popular belief, symmetrical triangles are not always bullish continuation patterns. They indicate a bias conflict, often resolving with a breakout in either direction based on prevailing momentum. Historically, crypto markets have seen such setups lead to declines rather than bull runs. For example, Ethereum’s 2018 triangle breakdown resulted in an 80% drop. ETH/USD weekly price chart feat. symmetrical triangle breakdown from 2018. Source: TradingView When it happens, the price typically rises or falls toward the level that is at a length equal to the triangle’s maximum height. Applying this technical rule on XRP brings its downside target to around $1.46, which aligns with the 50-week exponential moving average. Trump embraces Bitcoin, not XRP XRP’s price slumped following the White House’s inaugural Crypto Summit on March 7, as optimism about its potential inclusion in a US strategic crypto reserve quickly faded. Despite initial excitement, President Donald Trump’s team clarified that the mentioned cryptocurrencies, Ethereum, Solana, Cardano, and XRP, were illustrative examples, not official selections. @DavidSacks , why are you walking back XRP's mention in Trump's crypto reserve plan like it was an afterthought? Almost like you were prompted to do so. The jig is up everyone knows what XRP is and why it's still being suppressed while every other SEC lawsuit gets dropped. Why… pic.twitter.com/96x6ZvBlIE — Jason Higgins 🇺🇸 (@JasonTrading589) March 7, 2025 Moreover, there’s no evidence the US government holds XRP, and Trump’s broader stockpile strategy , focusing on altcoins, excludes new purchases. This revelation has already triggered a 10% decline in the XRP market. Related: US crypto reserve could boost Bitcoin market cap by $460B — Research On the other hand, Bitcoin is gaining clear favors from the Trump administration , with the US also holding approximately $17.7 billion in BTC. Meanwhile, the XRP/BTC pair is consolidating within a historical distribution zone, though it remains above the 200-2W EMA (the blue wave) at around 2,459 satoshis. XRP/BTC two-week price chart. Source: TradingView A break below the 200-2W EMA could push XRP/BTC toward the 50-2W EMA (the red wave) at around 1,700 satoshis, triggering a correlated decline in XRP/USD and thus amplifying the risk of a 20% drop. XRP volume explosion mirrors 2021 bear market XRP’s trading volumes recently surged to record levels, with analyst Martunn warning that XRP is in a distribution phase , where large holders offload positions to retail buyers after a major rally. XRP volume bubbles. Source: CryptoQuant This volume surge follows XRP’s 600% rise from November 2024 to January 2025, a classic setup for distribution. In 2021, a similar volume explosion preceded a prolonged downtrend, as selling pressure eventually outweighed demand. If history repeats, XRP could face another major correction, aligning with the symmetrical triangle breakdown explained above. The decline in XRP whale holdings further reflects distribution. The whale balance has dropped from 94.21 billion to 90.21 billion XRP in a year while erasing the increase from the post-US election “Trump pump.“ Whales are large investors or entities holding significant amounts, which in this case are addressed with balances of over 1 million XRP. XRP addresses with over a million tokens. Source: Messari When whales offload, it often signals a lack of confidence in the asset’s near-term performance, as these players typically have access to better market insights or strategic plans. Their selling can create a ripple effect, reducing liquidity and increasing selling pressure as smaller investors follow suit. This article does not contain investment advice or recommendations. Every investment and trading move involves risk, and readers should conduct their own research when making a decision. # Altcoin # XRP # Markets # Donald Trump # Tech Analysis # Market Analysis # Altcoin Watch Add reaction