
NewsBTC
08:00 UTC
Med
While the news addresses a crucial long-term security concern for solana, the announcement emphasizes that no immediate network changes are required. this suggests the market impact might be muted in the short term, but it lays a strong foundation for future network resilience, which is a positive long-term signal.
High
Neutral
The article mentions sol's price retraced below $85, showing recent bearish movement. however, the quantum computing news itself is a forward-looking and proactive measure, not an immediate catalyst for price change. the market reaction will likely depend on broader market sentiment and how this long-term security development is interpreted by investors.
#sol
#quantumcomputing
#blockchainsecurity
UToday
07:51 UTC
Med
The exploit targeted internal team wallets, not user funds, limiting direct financial impact on investors. however, it raises concerns about the security protocols of the zetachain network, potentially affecting investor confidence.
Med
Neutral
The price reaction will likely depend on how the market perceives the severity of the exploit and the effectiveness of the implemented fixes. while user funds were safe, such incidents can lead to a temporary dip in confidence and price before a recovery, or a more prolonged downturn if the market interprets it as a significant systemic risk.
#zetachain
#blockchainsecurity
#cryptonews
UToday
07:50 UTC
High
The article describes a memecoin called scam that experienced a 54,661% rally in a matter of hours, driven by a social catalyst related to elon musk's remarks. this demonstrates extreme volatility and detachment from fundamentals.
Low
Bearish
The article explicitly states, 'it won't hold for too long' and describes the typical memecoin lifecycle of rapid expansion followed by distribution. early buyers are selling, and the price action is condensed into hours, suggesting an imminent crash.
#scam
#memecoin
#elonmusk

CoinDesk
07:29 UTC
Med
Ondo finance's integration of proxy voting for its tokenized equities could increase investor confidence and adoption of tokenized assets, potentially driving demand for ondo tokens. however, the direct impact on the ondo token price might be moderate as this feature primarily enhances the utility of the tokenized equities themselves, not necessarily the governance of ondo dao directly.
Med
Bullish
The addition of proxy voting addresses a key gap in tokenized equities, making them more attractive to traditional investors. this could lead to increased demand for ondo's tokenized products and, by extension, the ondo token.
#ondo
#tokenizedequities
#defi


NewsBTC
07:00 UTC
High
Bitcoin closing above the 21-week ema for the first time since january is a significant technical indicator. this, combined with analysts forecasting a potential breakout towards $88,000, suggests strong bullish sentiment and a potential for substantial price movement.
Med
Bullish
The key weekly close above $78,000 and reclaiming the 21-week ema are bullish signals. analysts are targeting $81,000-$82,500 initially, with potential for a move towards $85,000-$88,000 and even a retest of $100,000 if momentum continues.
#btc
#crypto
#bitcoin

Cointelegraph
07:00 UTC


CoinDesk
06:40 UTC
Med
Three boj members advocating for a rate hike have caused the yen to rise and bitcoin to fall. this suggests that increased interest rates in japan could lead to a 'carry trade' unwind, where investors sell riskier assets like bitcoin to pay back yen-denominated loans. while not a direct policy change, the increased hawkish sentiment is a notable development.
High
Bearish
The article explicitly states that bitcoin fell following the boj news. the reasoning provided is the potential for a 'carry trade' unwind, which historically has led to risk aversion and selling pressure on cryptocurrencies.
#BTC
#Yen
#MonetaryPolicy
UToday
06:14 UTC
Med
Peter brandt, a well-known commodity trader, is bearish on bitcoin reaching $250k in 2026, citing a technical analysis of an ascending channel pattern. while this doesn't rule out further gains, he suggests it's not a bullish reversal pattern and could indicate a corrective move.
Med
Neutral
Brandt's analysis suggests that while the price is in an ascending channel, it is not a bullish bottoming pattern. this implies a potential for continued upward movement within the channel but cautions against expectations of a strong parabolic rally to $250k by 2026. the price action is described as 'choppy'.
#BTC
#Crypto
#TechnicalAnalysis


NewsBTC
06:00 UTC
High
Bitmine's record accumulation of 5 million eth, targeting 5% of supply, signifies strong institutional conviction and a belief in eth's long-term value proposition. their accelerated buying pace, the highest since late 2025, directly signals demand pressure. the ceo's bullish outlook, citing eth's performance against s&p 500 and its role as a store of value and collateral, further strengthens this positive sentiment. the mention of tokenization and ai adoption as drivers also adds to the bullish narrative. however, the immediate price retracement after failing to break $2,400 resistance tempers the short-term impact, suggesting profit-taking or resistance challenges.
High
Bullish
The price direction is predominantly bullish due to bitmine's aggressive accumulation strategy, record holdings, and stated long-term objective of acquiring 5% of ethereum's supply. the ceo's commentary on eth's resilience, outperformance, and its role as a store of value, collateral, and beneficiary of tokenization and ai trends, supports a positive outlook. the company's increased buying pace further reinforces this expectation. while there was a short-term retracement, the underlying accumulation and fundamental arguments suggest a bullish trend.
#ETH
#Bullish
#Institutional
CoinDesk
05:35 UTC
High
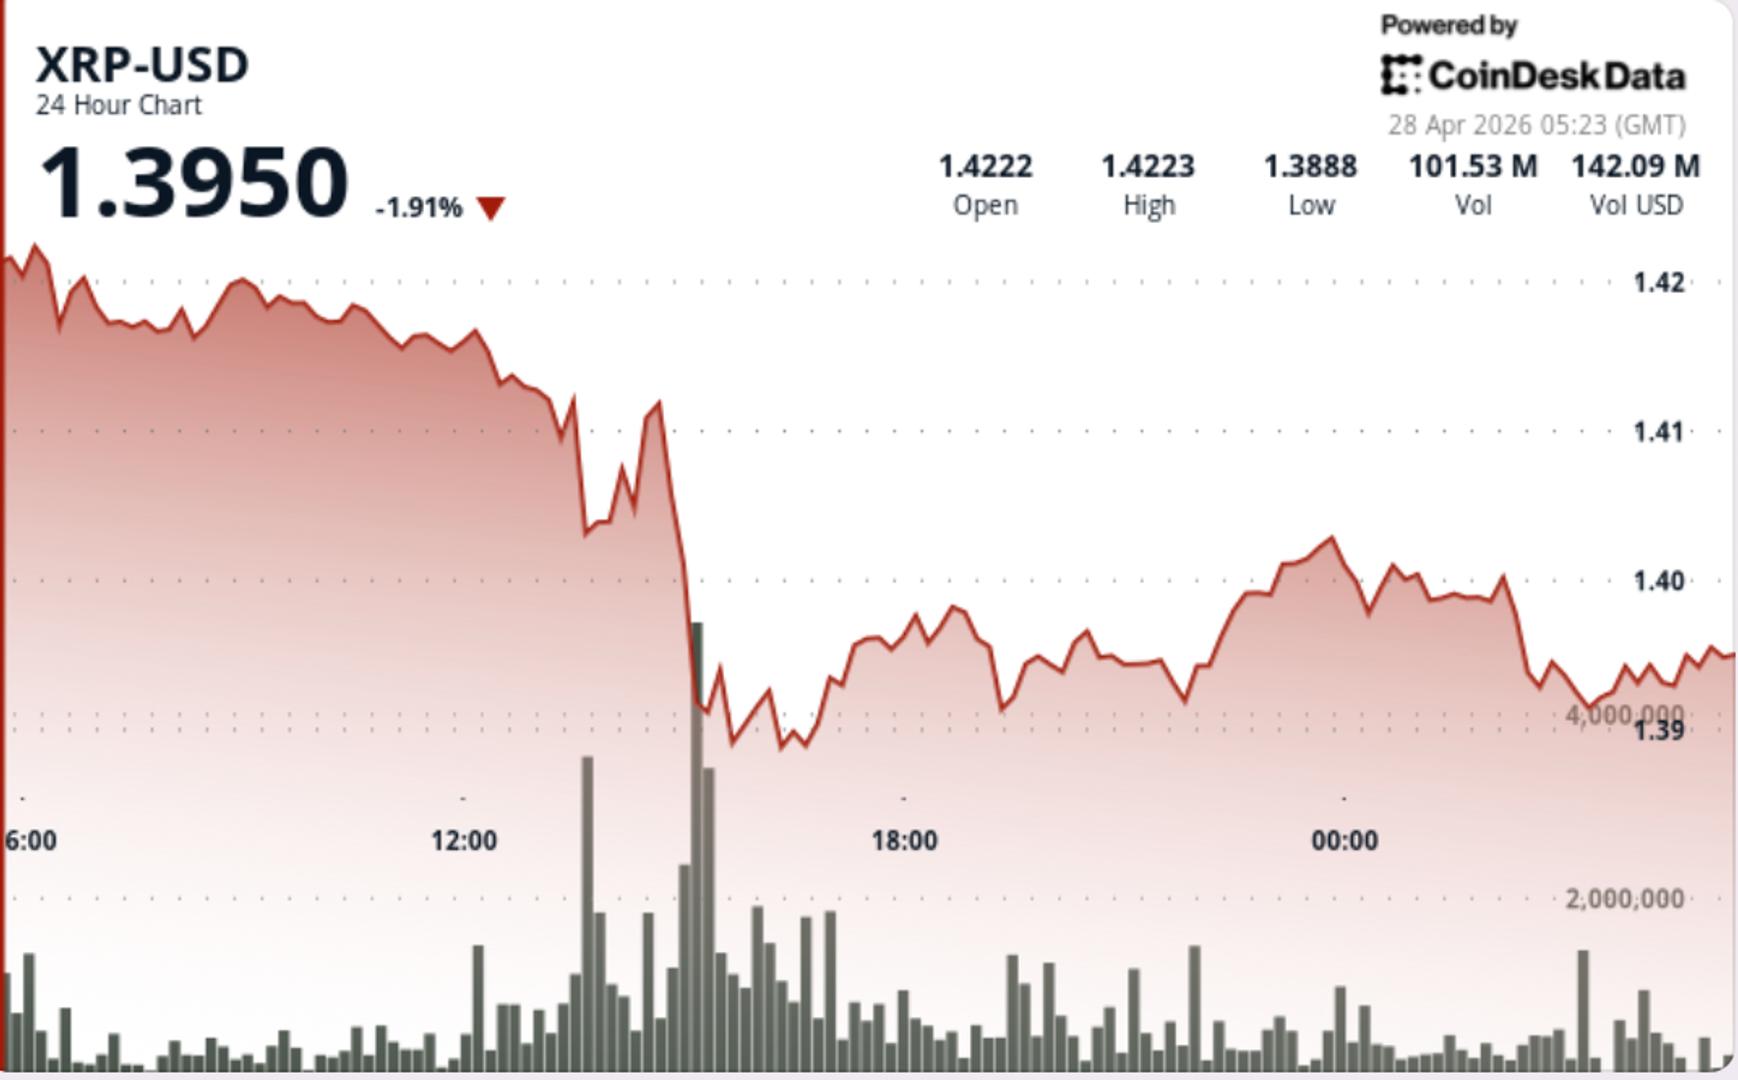
Xrp has broken below a crucial support level ($1.40) on high volume, indicating strong selling pressure and a shift in market sentiment. this breakdown from a multi-month triangle pattern suggests a potential continuation of the downtrend.
High
Bearish
The decisive breach of the $1.40 support level, previously defended by buyers, coupled with increasing bitcoin dominance drawing capital away from altcoins, points to a bearish trajectory for xrp in the short to medium term. immediate downside targets are identified at $1.37 and $1.31.
#XRP
#Bearish
#Crypto


CoinDesk
05:23 UTC
High
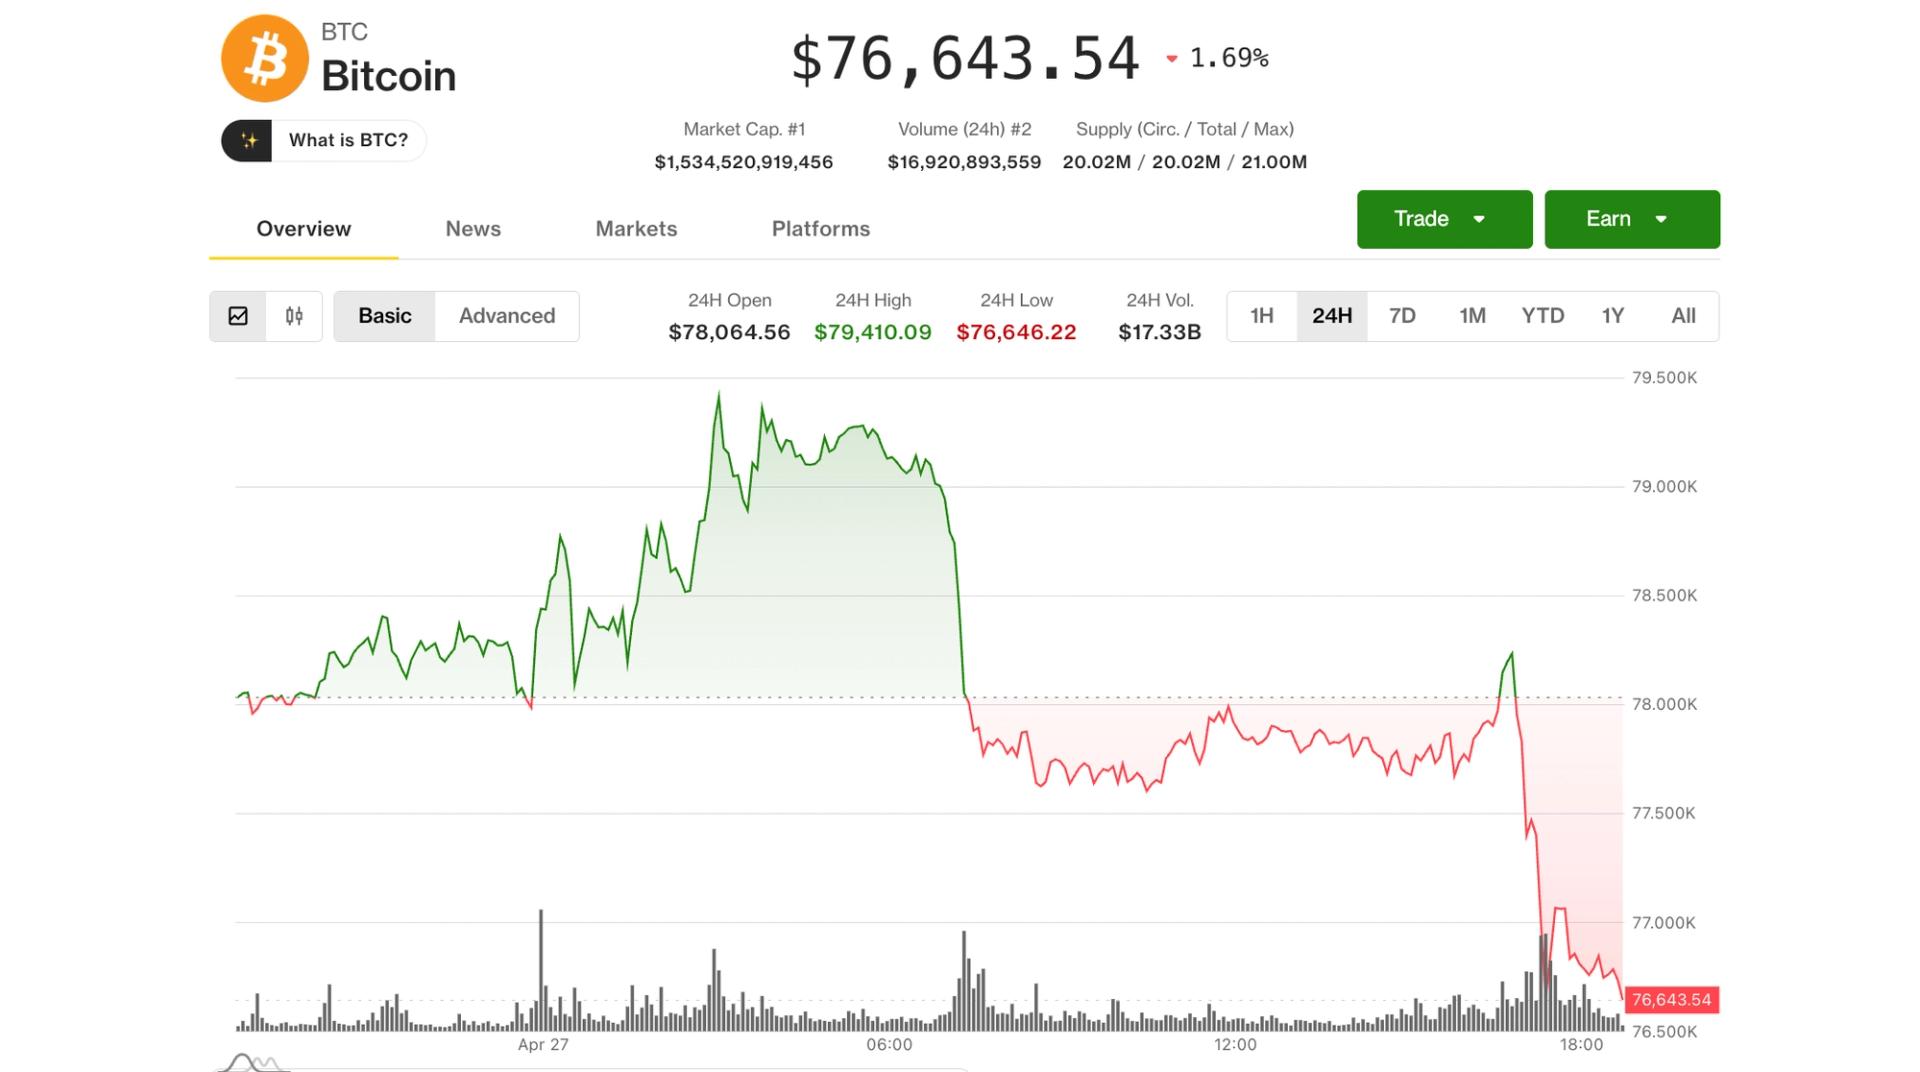
The news highlights a significant price drop in bitcoin and other major cryptocurrencies, directly linked to broader market sentiment influenced by geopolitical events (hormuz standoff) and macroeconomic factors (oil prices, fed policy).
High
Bearish
Bitcoin and other major cryptocurrencies are experiencing a pullback, with bitcoin failing to break through the $79,000 resistance multiple times. this suggests a current bearish trend, exacerbated by rising oil prices and geopolitical uncertainty, although potential catalysts for a bullish move are also mentioned.
#BTC
#CryptoMarket
#Geopolitics


NewsBTC
05:08 UTC
Med
The article suggests dogecoin is showing positive momentum, potentially leading to larger gains. this is based on technical indicators and price action, indicating a moderate upward pressure.
Med
Bullish
The article highlights dogecoin trading above key moving averages and trendlines, with the macd and rsi in bullish territory. it suggests potential upside targets if resistance levels are broken.
#doge
#crypto
#bullish

NewsBTC
05:00 UTC
High
The analyst suggests a potential 200% rally for monero, which is a significant price movement. the reasoning is based on structural improvements and a broader thesis on privacy coins.
Med
Bullish
The analyst identifies a multi-year structure showing higher lows and higher highs, which supports a bullish outlook. the target is set significantly higher than the current price.
#XMR
#Monero
#PrivacyCoin

CoinDesk
04:42 UTC
High
The article highlights multiple significant factors pressuring bitcoin: uncertainty around the federal reserve's rate decisions due to sticky inflation (driven by oil prices), and potential slowdowns in ai demand affecting miner selling dynamics. these are major macro and industry-specific concerns.
High
Bearish
Bitcoin is currently trading lower, and the analysis suggests it's facing resistance around $80,700. the immediate outlook is cautious, with price movements likely tied to upcoming economic data that could influence fed policy, rather than immediate bullish catalysts.
#btc
#fed
#oil


NewsBTC
04:08 UTC
Med
The article suggests xrp has entered a short-term bearish zone with a break below a bullish trend line and key moving averages, indicating potential for further downside.
High
Bearish
The price has failed to stay above $1.440, broken below a bullish trend line at $1.430, and is trading below the 100-hourly sma. further declines are anticipated if it stays below $1.4150, with potential targets at $1.3920 and $1.3840.
#XRP
#Crypto
#Bearish

Cointelegraph
03:48 UTC

NewsBTC
03:18 UTC
Med
The article details a recent price drop for ethereum below $2,350, indicating a loss of momentum and potential for further declines if key resistance levels are not overcome. while not a catastrophic drop, it suggests a bearish short-term outlook.
High
Bearish
The price has declined below key support levels ($2,350, 100-hourly sma) and formed a bearish trend line. the macd is in the bearish zone and the rsi is below 50, both indicating bearish momentum. the article outlines potential further downside targets if support breaks.
#ETH
#Ethereum
#Crypto

NewsBTC
03:00 UTC
Med
The article suggests that while xrp's price has recovered, the underlying risk appetite and trader confidence (indicated by leverage ratios) have not fully rebounded. this suggests a less speculative and potentially more stable recovery, but also implies that a strong, rapid price surge might be less likely without a re-emergence of high risk appetite.
High
Neutral
The price action is described as trading sideways in a consolidation range. while there are subtle signs of higher lows since early april, xrp remains below key moving averages (100-day and 200-day), indicating a broader bearish trend. the immediate outlook is dependent on breaking key resistance at $1.50.
#xrp
#cryptoquant
#leverage

NewsBTC
02:19 UTC
Med
Bitcoin has experienced a rejection from a key resistance level and is showing downside pressure. while there's potential for a bounce, the bearish trend line and indicators suggest a consolidation or further decline in the short term.
High
Bearish
Bitcoin failed to break above $78,500 and corrected gains, trading below key moving averages and facing a bearish trend line. immediate support at $76,500 is crucial; a break below could lead to further losses.
#BTC
#Crypto
#Trading

NewsBTC
02:00 UTC
Med
A shift to neutral sentiment from extreme fear is a positive sign, indicating reduced selling pressure. however, neutral sentiment itself doesn't guarantee immediate price increases, but it sets a more stable foundation for potential growth.
High
Bullish
The index moving out of extreme fear and into neutral territory suggests that the market is no longer dominated by panic selling. historically, prolonged periods in extreme fear can precede market bottoms, making this shift a potentially bullish signal for bitcoin's price.
#btc
#crypto
#fearandgreed

Cointelegraph
01:26 UTC

NewsBTC
00:30 UTC
High
The article highlights aggressive buying behavior in ethereum, reminiscent of previous bear market bottoms. this strong on-chain data suggests a potential shift in market sentiment and could lead to a significant price reversal.
High
Bullish
The taker buy sell ratio surging to its highest levels since early 2023, coinciding with a price decline, indicates strong accumulation and seller exhaustion. this divergence suggests that despite the current bearish chart pattern, underlying demand is overpowering selling pressure, pointing towards a potential price upswing.
#ETH
#Crypto
#Buy
UToday
00:01 UTC
High
Ethereum has suddenly entered a downtrend after failing to maintain momentum above the $2,000 mark. it's now trading below key short-term and mid-term moving averages, which have turned into resistance. the lack of volume during attempted recoveries and the absence of structural strength in recent higher lows suggest that sellers are in control. the market is vulnerable to further declines unless buyers step in decisively.
High
Bearish
Ethereum failed to break through resistance around the $2,300-$2,400 range, leading to a loss of structure and a return to a downtrend. it is currently trading below key moving averages that are now acting as resistance. the trend remains negative as long as it stays below the longer-term downward sloping average. the market is likely to test lower support zones.
#ETH
#Ethereum
#Crypto

Cointelegraph
2026-04-27
23:19

NewsBTC
2026-04-27
23:00
High
The article suggests a potential surge to $3,400 and even higher targets around $7,000, indicating a significant potential price movement for ethereum based on technical analysis and market momentum.
Med
Bullish
The analysis indicates that ethereum is mirroring bitcoin's bullish momentum, breaking through key resistance levels and showing improving structure across daily and weekly timeframes, with multiple analysts projecting significant upside.
#ETH
#Ethereum
#Crypto


Decrypt
2026-04-27
22:22
Low
The news concerns elon musk's xai and colorado's ai law. while elon musk is influential in the crypto space, this specific legal battle doesn't directly involve any cryptocurrencies or blockchain technology. therefore, the direct impact on crypto prices is minimal.
High
Neutral
There is no direct link between this legal development and the price movement of any cryptocurrency. it's a regulatory and legal matter concerning ai development.
#AI
#Regulation
#Legal


Cointelegraph
2026-04-27
21:44

CoinDesk
2026-04-27
21:40
High
The massive rescue plan involving hundreds of millions of dollars from industry leaders to support aave users after a hack is a significant positive development for aave. it shows strong ecosystem support and a commitment to stabilizing the protocol, which should boost user confidence and potentially aave's price.
High
Bullish
The news signifies a strong collaborative effort to mitigate losses and restore stability, which is generally bullish for the affected token (aave) and the broader defi ecosystem. increased confidence and restored functionality often lead to price appreciation.
#AAVE
#DeFi
#CryptoRescue
UToday
2026-04-27
21:34
Low
The article focuses on holder count growth, which is a long-term metric and not typically a direct driver of short-term price action. while eth's growth is impressive, it doesn't directly signal an immediate price surge for eth or negatively impact xrp.
High
Neutral
The article highlights growth in holder numbers for various cryptocurrencies but does not provide any specific catalysts or market sentiment shifts that would directly predict an immediate price movement for xrp or eth. it's more of a state-of-the-network report.
#eth
#xrp
#cryptoadoption

NewsBTC
2026-04-27
21:30
Med
The article discusses ripple's monthly unlocking and selling of xrp, which is a known and ongoing process. while the theory of dilution is presented, it's framed as an existing mechanism rather than a new development. the impact is moderate as it relates to a continuous supply flow.
Med
Neutral
The article details the mechanics of xrp unlocks and sales, which are ongoing and factored into the market. while the commentator argues this leads to dilution and negatively impacts price (citing 6 consecutive down months), the market price is influenced by many factors, and this continuous sell pressure is a known characteristic of xrp's tokenomics.
XRP
Ripple
Crypto

CoinDesk
2026-04-27
21:00
High
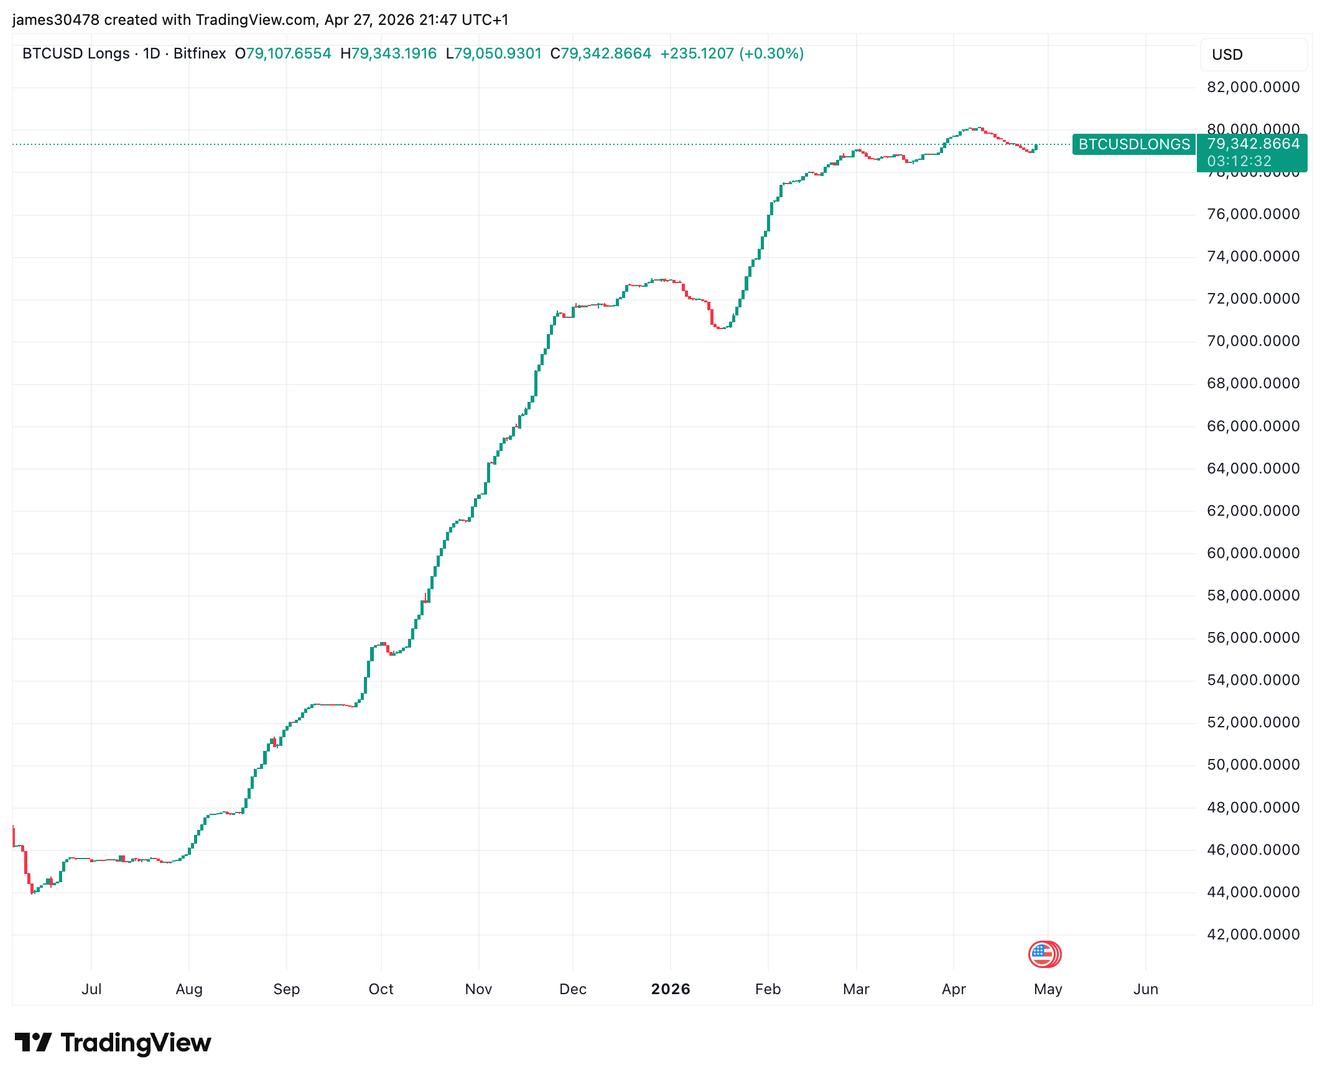
Multiple bearish indicators including a negative coinbase premium index, high bitfinex whale positioning, and failure to reclaim the short-term holder realized price suggest significant short-term downside risk for bitcoin.
High
Bearish
The coinbase premium index turning negative signals weakening u.s. institutional demand. the persistent high long exposure from the bitfinex whale suggests a lack of conviction for further upside, and failure to reclaim the sthrp indicates pressure from recent buyers potentially exiting.
#btc
#bearish
#crypto
Decrypt
2026-04-27
20:56
Med
The 'defi united' initiative successfully raised $303 million to cover losses from the kelp dao exploit. this is a significant positive development for the defi ecosystem, as it helps restore confidence and mitigate liquidity issues on platforms like aave. the raised funds are intended to restore rseth, which was exploited, and ease the strain on aave's liquidity. the involvement of major players like consensys and the avalanche foundation adds credibility to the effort. however, the total amount raised is still contingent on governance proposals, introducing a degree of uncertainty. the direct impact on eth price might be moderate as the funds are primarily for restoration and not direct investment, but it bolsters overall ecosystem health. usdt and usdc could see a slight positive sentiment boost due to efforts to ease liquidity on aave.
Med
Bullish
The successful fundraising effort to cover a major exploit is a significant positive for the defi sector. it demonstrates resilience and cooperation within the crypto community, which can boost investor confidence. while the immediate impact on eth might be tempered by the fact that the funds are for restoration, the overall strengthening of the defi ecosystem and reduced systemic risk is generally bullish for eth and other major cryptocurrencies like usdt and usdc, which benefit from a stable defi environment.
#defi
#eth
#aave

NewsBTC
2026-04-27
20:55
Med
The article suggests a potential $10 price for xrp by 2027, contingent on two major catalysts: us regulatory clarity and significant institutional capital inflow. while these are strong drivers, the timeline and the 'must-happen' nature of these events introduce uncertainty, limiting the immediate impact.
Med
Neutral
The article presents a dual outlook. it highlights bullish indicators like positive etf inflows and whale accumulation, but also stresses significant headwinds from regulatory uncertainty. the price is presented as neutral in the short term, with a bullish potential towards $10 by 2027 if specific conditions are met. if these conditions aren't met, it suggests a capped price around $3.
#xrp
#regulation
#institutionaladoption
Decrypt
2026-04-27
20:45
CoinDesk
2026-04-27
20:35
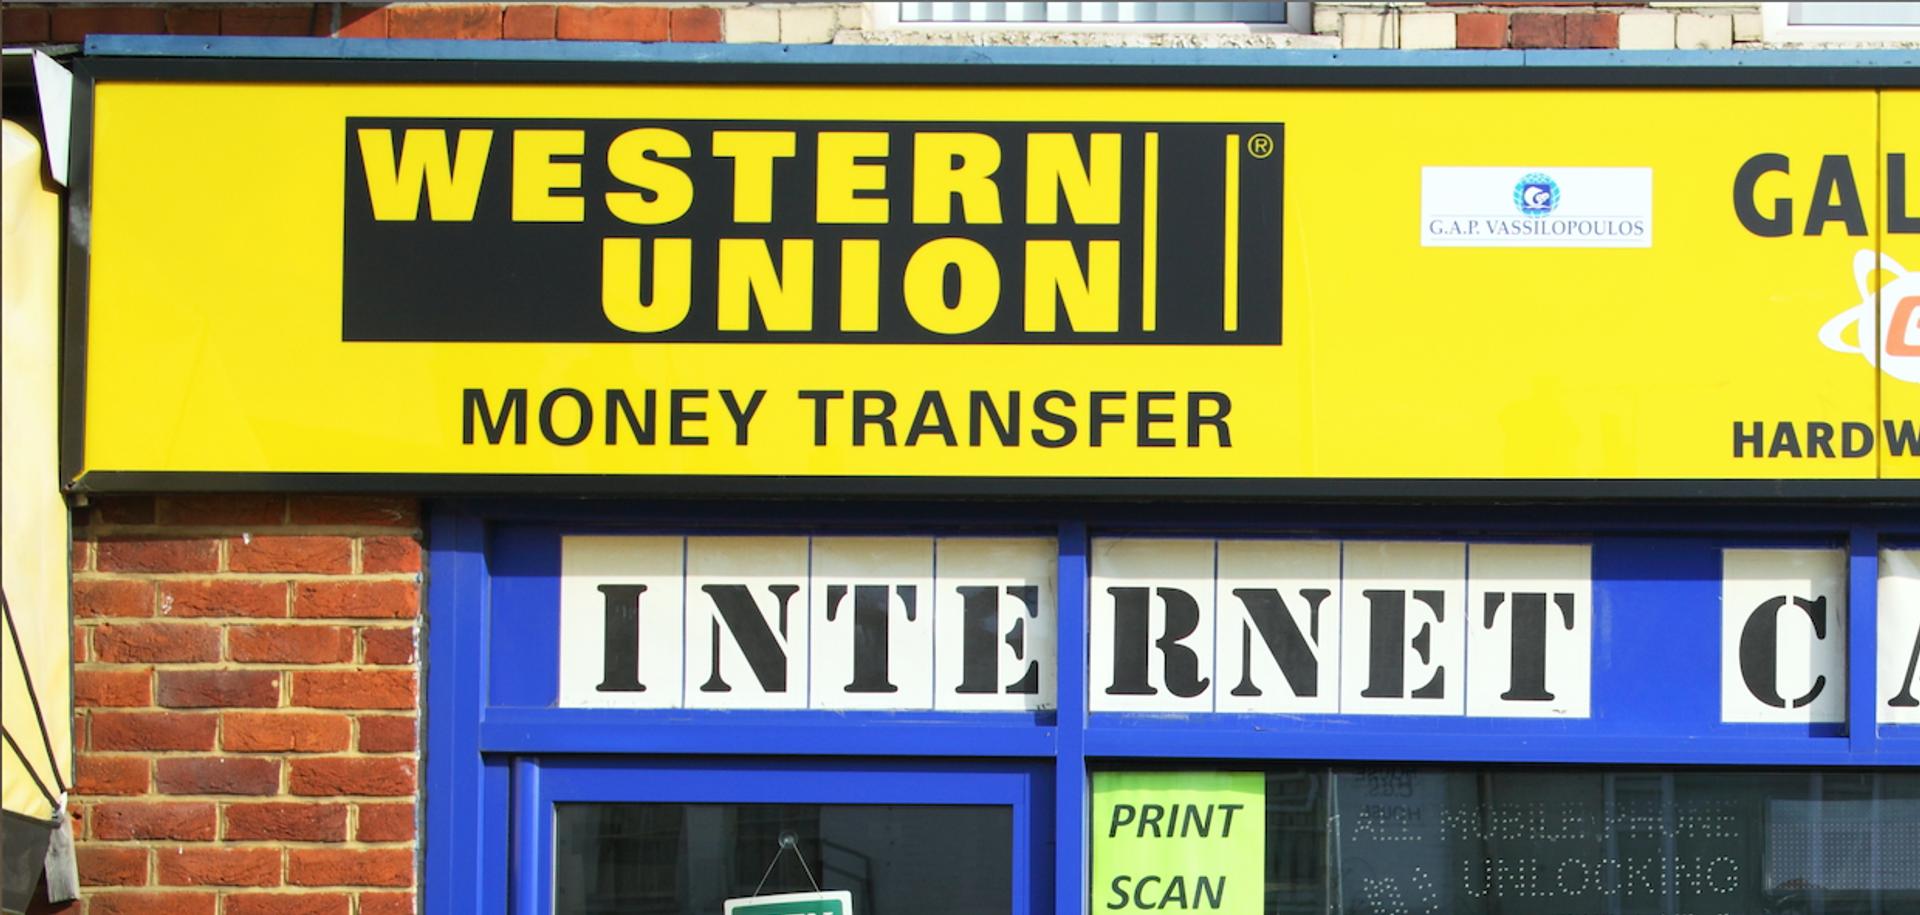
High
Western union's entry into stablecoins, particularly on solana, signifies major institutional adoption. this could drastically increase demand for sol for transaction settlement and network usage, while also boosting confidence in usdpt.
High
Bullish
The news is bullish for solana due to increased utility and potential network growth. the stablecoin itself, usdpt, is also expected to see adoption, especially given western union's global reach and its plans for a linked card and cash-out options.
#sol
#usdpt
#westernunion
Decrypt
2026-04-27
20:15
Low
The proposed hard fork, ecash, aims to reassign coins associated with satoshi nakamoto. while this is a novel idea, past bitcoin and ethereum hard forks have generally underperformed their original counterparts. furthermore, the success of such a fork relies on widespread network adoption, which is unlikely given the controversial nature of reassigning coins and the general consensus among developers. jameson lopp's dismissal of the move as 'clever outrage marketing' further suggests limited impact on bitcoin's core value.
Low
Neutral
While the news itself might create some short-term noise or speculative trading around bitcoin, the fundamental value and price of btc are unlikely to be significantly impacted. the proposal lacks the broad support needed to disrupt the existing bitcoin network or its market position. any price movement would likely be driven by speculation rather than a fundamental shift in bitcoin's utility or adoption.
#BTC
#HardFork
#CryptoNews
Decrypt
2026-04-27
20:07
Low
This news relates to intellectual property and ai protection for a celebrity, taylor swift. it does not directly involve any cryptocurrencies or blockchain technology, hence the low impact on the crypto market.
High
Neutral
There is no direct or indirect correlation between taylor swift's trademark filings for her voice and image and the price movements of cryptocurrencies.
#AI
#IntellectualProperty
#CelebrityNews

NewsBTC
2026-04-27
20:00
Med
The article discusses the debate around whether xrp and other altcoins are in accumulation or distribution phase, highlighting conflicting market signals. this uncertainty can lead to moderate price volatility as traders assess the situation.
High
Neutral
The article presents a balanced view, acknowledging that evidence is unresolved. it poses questions about whether xrp is in accumulation (suggesting future growth) or distribution (suggesting a potential decline), leading to a neutral short-term outlook until clearer signals emerge.
#XRP
#Altcoins
#Crypto

Cointelegraph
2026-04-27
19:59
Decrypt
2026-04-27
19:53
Med
The news highlights a significant drop in us programming job growth after the launch of chatgpt, indicating ai's potential to automate and reduce the need for developers. while this directly impacts the tech sector and potentially reduces demand for new developers in the short to medium term, it could indirectly affect cryptocurrencies like eth, which are heavily utilized in tech development and defi. a slowdown in tech innovation or funding due to automation concerns might lead to reduced investment in crypto projects. however, the news does not directly mention crypto or any specific cryptocurrency.
High
Neutral
The news focuses on the impact of ai on developer jobs, not directly on cryptocurrency prices. while there could be indirect effects on eth through reduced investment in the tech sector or a shift in developer focus, there's no immediate, direct correlation suggested to cause a bullish or bearish price movement for eth.
#ai
#eth
#techjobs
UToday
2026-04-27
19:16
Med
A large billboard in las vegas and an upcoming conference can generate positive sentiment and visibility, but the direct price impact may be limited as the community is currently focused on underperformance.
High
Neutral
While the event and marketing aim to be bullish, the strong negative sentiment from long-term holders about recent price underperformance creates a neutral immediate outlook. positive sentiment may build if the conference yields significant announcements or partnerships.
#xrp
#ripple
#crypto


Cointelegraph
2026-04-27
18:35

NewsBTC
2026-04-27
18:30
High
The us military's exploration of bitcoin's cryptographic architecture for operational security and power projection, alongside its holdings, suggests a significant shift in perception. this elevates bitcoin beyond a speculative asset to a potential strategic tool, which could attract institutional and governmental interest, driving demand.
High
Bullish
The narrative shift towards bitcoin as a strategic military asset, coupled with active testing and infrastructure support by a major military command, implies a growing acceptance and potential for increased demand from governmental entities. this could lead to a significant positive price movement.
#btc
#nationalsecurity
#geopolitics
Decrypt
2026-04-27
18:12
Low
The news concerns security vulnerabilities in ai agents and their potential to execute unauthorized financial transactions. while this could indirectly affect stablecoins if widespread fraud occurs, the direct impact on stablecoin prices themselves is likely to be minimal. the primary concern is the security of ai systems and payment processors, not the stablecoins directly.
High
Neutral
This news does not directly impact the price of cryptocurrencies like bitcoin or ethereum. it's a security and ai development story, not a market-moving event for digital assets.
#ai
#cybersecurity
#technews

CoinDesk
2026-04-27
17:49
Low
The announcement of the mara foundation is a positive development for bitcoin's long-term health and resilience. however, its direct and immediate impact on btc price is likely to be low as it's focused on open-source development and research rather than direct market intervention or immediate supply/demand shifts.
High
Neutral
While the news is fundamentally positive for bitcoin's future, it does not present a catalyst for immediate price appreciation. the focus on long-term network health and research means the price impact will be gradual, if any, and not a short-term driver.
#BTC
#Bitcoin
#Crypto
Decrypt
2026-04-27
17:44
Low
This news is related to google employees' ethical concerns about ai contracts and does not directly impact cryptocurrency prices. while ai development can indirectly influence the tech sector, there's no immediate link to major cryptocurrencies like btc or eth.
High
Neutral
There is no direct correlation between google employees' internal discussions about military ai contracts and the price movement of any cryptocurrency. the news pertains to corporate ethics and military-tech partnerships, not the digital asset market.
#AI
#TechEthics
#Google
Decrypt
2026-04-27
17:37
Low
While a notable purchase by a publicly traded company, $60 million is a small fraction of bitcoin's overall market capitalization and daily trading volume. the impact is further diluted by strive's previous large purchases.
High
Neutral
The purchase itself is a bullish signal, but it's a continuation of an existing strategy by a company already heavily invested in bitcoin. the market has largely priced in such corporate treasury moves, and the immediate price impact is minimal without broader market sentiment shifts.
#BTC
#CorporateTreasury
#Strive
CoinDesk
2026-04-27
17:17
Med
Rising oil prices and geopolitical tensions (iran risks) are currently creating broader market uncertainty, which is leading to a short-term pullback in bitcoin. this is impacting bitcoin by making investors more risk-averse.
High
Neutral
While the immediate trend is bearish due to profit-taking and macro concerns, the underlying demand from etfs and institutions suggests potential for recovery. the article points to consolidation around $75,000 as a likely scenario, indicating a neutral short-to-medium term outlook.
#btc
#geopolitics
#oil
Decrypt
2026-04-27
17:15
Low
The news discusses donald trump's evolving stance on prediction markets, which are a niche area and not directly tied to major cryptocurrency assets like bitcoin or ethereum. while some prediction markets may involve crypto, the core of the article is about the regulatory and public perception of these markets, not the underlying crypto assets themselves.
Med
Neutral
There is no direct news that impacts the price of major cryptocurrencies. the discussion is centered on prediction markets, which are a separate financial instrument, although they can sometimes be linked to crypto events.
#PredictionMarkets
#Regulation
#Trump

Cointelegraph
2026-04-27
17:15
UToday
2026-04-27
17:08
Med
A significant purchase by a major institutional investor like strategy can add buying pressure, but the market has already priced in large corporate holdings. the impact is moderate as it reinforces existing bullish sentiment.
High
Bullish
This purchase signals strong institutional confidence in bitcoin, especially since it was made during a price decline. this 'buy the dip' mentality from a large player often encourages further buying.
#btc
#strategy
#institutionaladoption

NewsBTC
2026-04-27
17:00
High
The analyst suggests a potential crash to $40,000, which would represent a significant drop from current levels and could trigger widespread panic selling if it materializes.
Med
Bearish
The analyst believes that current price action above $80,000 might be a 'bull trap' and that significant sell pressure is expected around $83,000-$88,000 due to underwater etf and short-term holders looking to break even or take profits. this could lead to a substantial decline towards $40,000.
#btc
#crypto
#bearmarket
Decrypt
2026-04-27
16:56
Low
This news is about a new trading feature on a specific exchange (gemini) and not directly tied to a specific cryptocurrency's fundamentals. while it could indirectly influence trading volume and strategy adoption across the market, its immediate price impact on individual coins is likely to be minimal.
High
Neutral
The news is about an infrastructure development (ai trading tools) rather than a direct catalyst for specific coin price surges or drops. it aims to improve trading efficiency and strategy implementation, which could have long-term effects but doesn't dictate immediate price movements for any particular asset.
#ai
#cryptotrading
#gemini

Pomp Letter
2026-04-27
16:40
High
The article highlights strong accumulation of bitcoin by long-term holders and significant short-seller interest. this, combined with a bullish market sentiment for risk assets like tech stocks, suggests a potential for rapid price appreciation in bitcoin.
High
Bullish
The combination of increasing demand from long-term holders, high costs for short sellers, and a generally positive macro environment for risk assets points towards an upward price trend for bitcoin.
#BTC
#Accumulation
#Bullish
Decrypt
2026-04-27
16:40
Med
The exploit led to a temporary network disruption and a 13-block reorg, which means a portion of transaction history was rewritten. while the immediate impact was managed by rewriting the chain, it highlights a security vulnerability in the mweb privacy layer, potentially impacting investor confidence.
Low
Bearish
The exploit and the security concerns associated with the mweb layer could lead to a short-term sell-off as investors become wary. the news overshadows any positive developments and highlights a risk factor for holders. the price has also been on a downward trend historically.
#ltc
#litecoin
#cryptosecurity

CoinDesk
2026-04-27
16:38
Med
The news discusses a proposed market-based solution for bad debt in the curve ecosystem, specifically related to crv. while the debt is relatively small ($700k), the market-based approach could attract buyers and potentially support the price of crv if the recovery plan succeeds. however, it's not a direct catalyst for a massive price surge.
High
Neutral
The proposal aims to resolve bad debt and offers a way for trapped lenders to exit and buyers to speculate on crv's recovery. the success of the plan depends on crv's price performance. if crv recovers, the bad debt could be resolved, but the current price of crv is far from the recovery levels, suggesting a neutral immediate outlook.
#crv
#defi
#curve
UToday
2026-04-27
16:37
Low
Peter schiff is a known bitcoin skeptic, and his opinions, while widely publicized, do not typically cause significant, sustained price movements in bitcoin itself. his criticisms are often already priced into market sentiment.
Low
Neutral
While schiff's comments are negative, microstrategy's continued buying of bitcoin, despite the criticism and higher yields on debt, suggests an underlying bullish conviction from the company. the market often views microstrategy's accumulation as a net positive or at least a neutral factor.
#btc
#peterschiff
#microstrategy

CoinDesk
2026-04-27
16:30
Med
While quantum threats are still distant, solana's proactive plan to integrate quantum-resistant cryptography like falcon could be seen as a positive step for long-term network security and investor confidence. however, the immediate impact on price is likely limited as the threat is not imminent.
High
Bullish
The news addresses a potential long-term vulnerability, which, if unaddressed, could have been a significant bearish factor. by outlining a clear, phased plan and having core teams aligned on a solution, solana mitigates future fud and demonstrates a commitment to network resilience, which is generally bullish for the asset.
#SOL
#QuantumResistant
#Solana

CoinDesk
2026-04-27
16:22
Med
The article suggests that bitcoin's current rally is on shaky ground due to low trading volume and a lack of conviction from major players. this makes the price vulnerable to sudden shifts if macroeconomic factors change.
High
Neutral
While the rally is showing signs of strain, the article doesn't predict an immediate downturn. it notes that institutional demand remains a support and that the risk/reward is asymmetric to the upside if a catalyst emerges. the current situation is described as hesitant rather than outright bearish.
#BTC
#Crypto
#MarketAnalysis
Decrypt
2026-04-27
16:05
CoinDesk
2026-04-27
15:49
High
The report projects a massive increase in cross-border b2b stablecoin payments to $5 trillion by 2035, with 85% of this value coming from b2b transactions. this indicates a significant shift from speculative use to institutional payment infrastructure, which could drive substantial demand for major stablecoins like usdt, usdc, and dai.
High
Bullish
The projected growth in b2b stablecoin payments suggests increased adoption and utility for stablecoins. as they become a core part of institutional payment infrastructure, demand should rise, positively impacting their value and stability.
#stablecoins
#b2bpayments
#defi

CoinDesk
2026-04-27
15:44
Med
Fidelity digital assets report indicates that while prices are muted, on-chain metrics and network activity suggest stabilization, with bitcoin leading this trend due to capital concentration in the most liquid asset.
High
Bullish
The report highlights improving on-chain metrics, momentum, and profitability indicators, suggesting a stabilizing corrective phase that could lead to further price appreciation for bitcoin.
#btc
#crypto
#fidelity
Decrypt
2026-04-27
15:38
Low
This news pertains to meta's acquisition of an ai startup and does not directly involve major cryptocurrencies or the broader crypto market infrastructure. while ai is a growing sector, this specific event is unlikely to have a direct price impact on crypto assets.
High
Neutral
There is no direct link between this regulatory decision concerning an ai acquisition and the price movements of cryptocurrencies. the crypto market is driven by its own set of factors, including macroeconomic trends, adoption rates, regulatory news specific to crypto, and technological developments within the blockchain space.
#AI
#Regulation
#Meta
UToday
2026-04-27
15:34
Med
A golden cross is a bullish technical indicator, suggesting a potential upward trend. the 30% gap to the 200-day moving average acts as a target, but reaching it depends on further confirmation.
Med
Bullish
The formation of a golden cross (23-day ma crossing above 50-day ma) and the rsi being in a neutral zone suggest a potential upward movement towards the 200-day moving average.
#xrp
#goldencross
#ripple

NewsBTC
2026-04-27
15:30
High
The article suggests a potential 900% rally for xrp, targeting $15, based on historical fractal patterns and a critical retest at $1.40. this significant price prediction, if realized, would be a major event for the cryptocurrency.
Med
Bullish
The analyst, javon marks, believes that xrp is retesting a critical support level at $1.40, which historically preceded a major parabolic move. if this retest holds, it could trigger a significant upward rally, potentially aiming for $15.
#XRP
#Crypto
#Bullish
CoinDesk
2026-04-27
15:05
Low
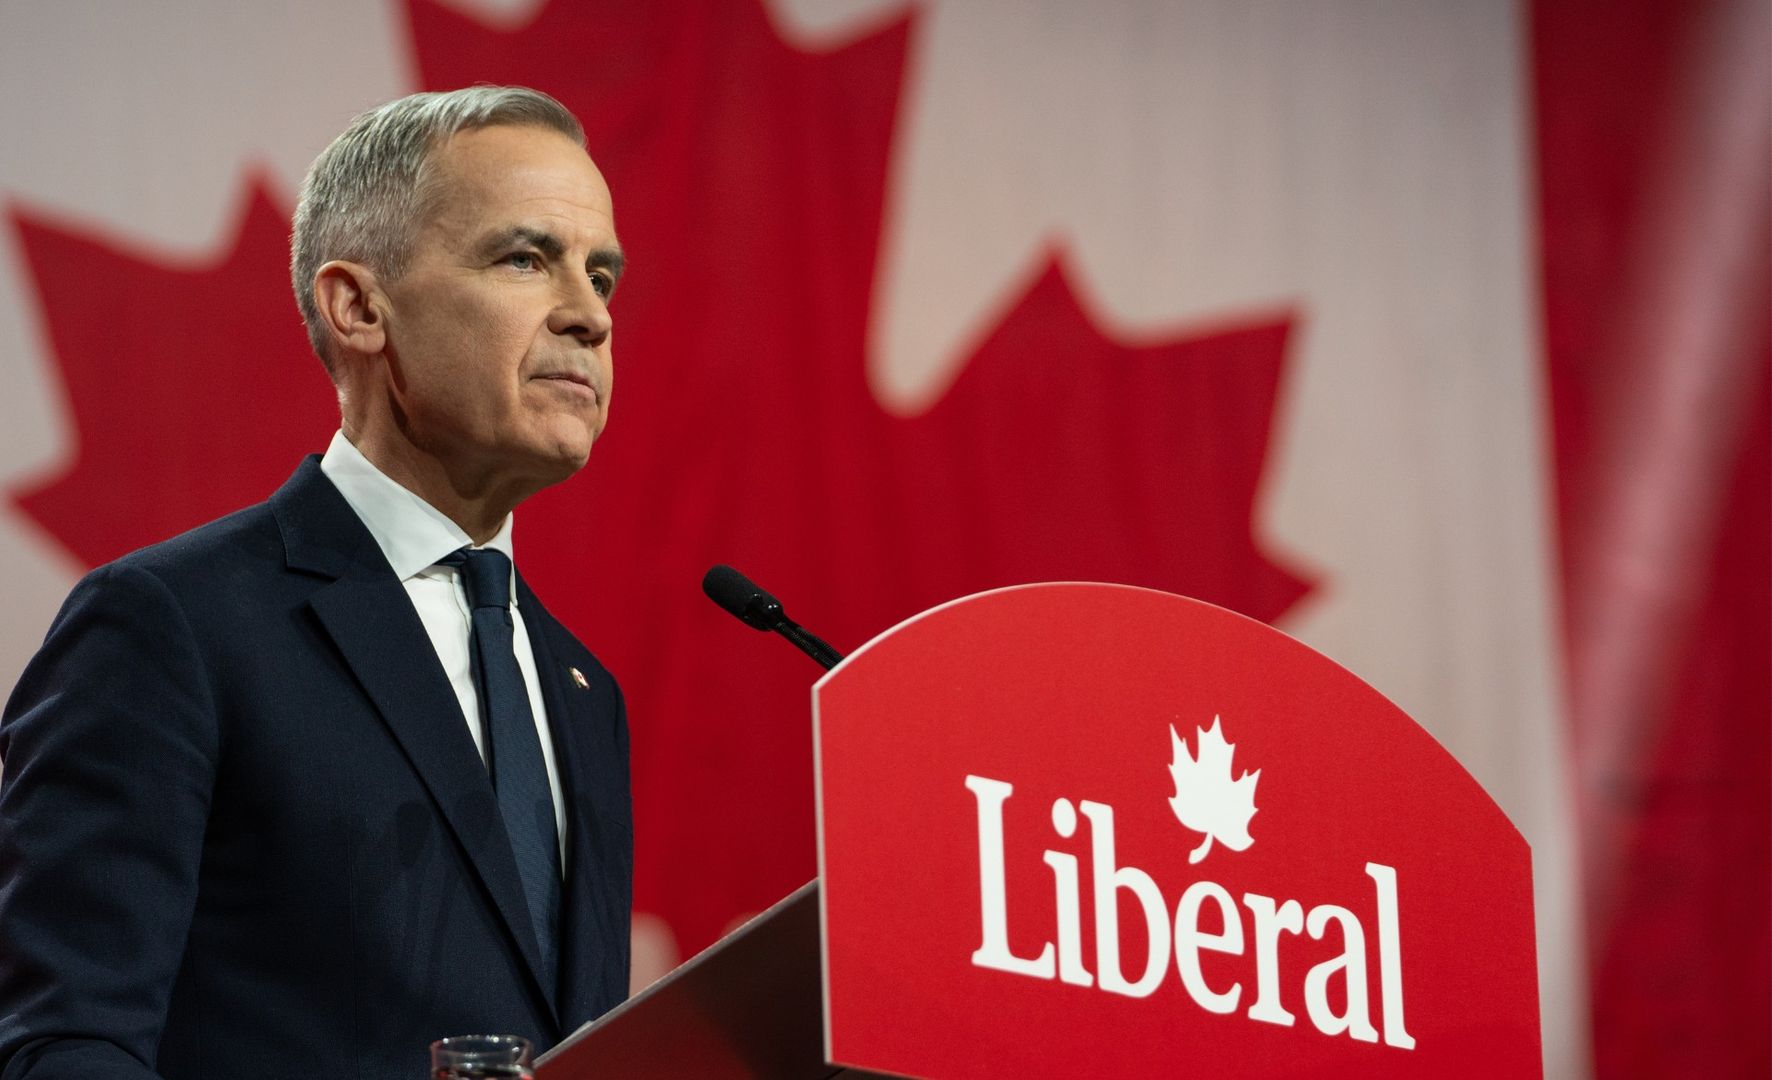
The news discusses a ban on crypto donations for political campaigns in canada. while it sets a precedent, the actual impact on bitcoin's price is minimal as crypto donations have played a very minor role in canadian politics. it's more of a regulatory clarification than a market-moving event for btc itself.
High
Neutral
This news is specific to political campaign finance regulations in canada and does not directly affect bitcoin's fundamental use cases, adoption, or market dynamics. therefore, it is unlikely to cause a significant price movement.
#Canada
#Regulation
#BTC
Decrypt
2026-04-27
14:57
Low
The news concerns a restructuring of the partnership between microsoft and openai, which does not directly involve any cryptocurrency. while microsoft's stock is mentioned as being slightly down, the broader crypto market is unlikely to be significantly impacted by this news.
High
Neutral
The restructuring focuses on business operations and intellectual property licensing between two technology companies. it does not introduce new fundamentals or catalysts that would directly influence cryptocurrency prices. microsoft's stock movement is marginal and doesn't signal a broader market trend for crypto.
#Microsoft
#OpenAI
#AI

CoinDesk
2026-04-27
14:37
Med
The article suggests that negative funding rates in bitcoin futures, despite a price rally, are not indicative of a broad bearish sentiment but rather structural hedging by institutions. this implies that the current price movement might be more resilient than a superficial analysis of futures markets suggests, but it doesn't guarantee a continued upward trend.
High
Neutral
While the article argues against a bearish interpretation of futures, it doesn't explicitly predict a strong upward or downward movement. it suggests that the price is not necessarily heading for a fall due to the futures market signal, but the underlying reasons for hedging could introduce complexity and uncertainty, leading to a neutral short-term outlook.
#BTC
#Crypto
#Analysis
Decrypt
2026-04-27
14:21
High
A significant buy of over 5 million eth by a major treasury firm, especially a company that aims to acquire 5% of the total eth supply, indicates strong conviction and potential for increased demand, which could positively influence the price.
High
Bullish
The massive accumulation of eth by bitmine, coupled with tom lee's bullish outlook and reasoning about eth's role as a store of value and collateral, suggests a positive sentiment and expected upward price movement.
#ETH
#Ethereum
#Buy
UToday
2026-04-27
14:11
Med
The milestone of 1 billion transactions on shibarium and significant user growth are positive indicators for the shiba inu ecosystem. however, shib's price is often influenced by broader market sentiment and meme coin dynamics, which can sometimes overshadow specific ecosystem developments.
High
Bullish
A 1 billion transaction milestone and a significant increase in user growth (24,000 new wallets in a week, with a single day spike of 10,718) suggest increasing utility and adoption of shibarium. this can lead to increased demand for shib.
#shib
#shibarium
#crypto
UToday
2026-04-27
14:11
Med
Crossing 1 billion transactions and reaching an all-time high in holders indicates strong network adoption and utility for shibarium. while positive, this is an ongoing trend and the direct immediate impact on shib price might be moderate, especially if not accompanied by broader market bullishness.
High
Bullish
Increased network activity and user growth typically correlate with growing demand and potential for future value appreciation for the associated token. this shows the ecosystem is being utilized, which is a fundamental positive for shib.
#shib
#shibarium
#crypto

Decrypt
2026-04-27
13:57
Low
While microstrategy is a significant holder of bitcoin, the article details a slowdown in their buying pace. this indicates reduced demand from a major player, but not a complete halt, suggesting a muted impact on overall bitcoin price.
High
Neutral
The slowdown in buying pace suggests decreased buying pressure from this specific entity. however, the overall market sentiment for bitcoin remains influenced by many other factors, and a single entity's reduced pace doesn't definitively signal a price direction without broader market context.
#btc
#microstrategy
#bitcoin


CoinDesk
2026-04-27
13:45
Low
The article discusses the general challenge of discerning signal from noise in financial markets, with a specific mention of bitcoin as an example. it does not provide specific price predictions or direct catalysts for btc.
High
Neutral
The article's focus is on the methodology of identifying market 'signal' amidst 'noise,' not on predicting the immediate price movement of any specific cryptocurrency. bitcoin is used as an illustrative example within this broader market commentary.
#Crypto
#Signal
#MarketAnalysis
UToday
2026-04-27
13:45
High
The article highlights a confluence of critical events: the fomc meeting, us gdp data, and corporate earnings, all occurring mid-week in april. these factors, coupled with inflation and recession concerns, could significantly influence investor sentiment and lead to substantial price swings for both bitcoin and xrp.
Med
Neutral
The article presents a 'perfect storm' scenario where positive or negative outcomes are equally plausible. a dovish fed pivot and strong gdp could be bullish, while stagflation fears and a 'sell in may' trap could lead to bearish price action. the outcome remains uncertain until the data is released.
#XRP
#BTC
#FOMC

CoinDesk
2026-04-27
13:43
High
Michael saylor's company, strategy, is a major holder of bitcoin. their consistent buying demonstrates strong conviction and adds significant buying pressure to the market, potentially influencing price positively.
High
Bullish
Continued accumulation by large, influential entities like strategy suggests confidence in bitcoin's future value. this also reinforces the narrative of bitcoin as a store of value and hedge against inflation.
#BTC
#MichaelSaylor
#HODL

CoinDesk
2026-04-27
13:17
High
A significant purchase of $236 million in eth by a major treasury firm, coupled with a prominent analyst (tom lee) labeling eth as a 'wartime store of value', signals strong institutional conviction and could attract further buying pressure.
High
Bullish
The substantial direct purchase by bitmine, combined with the positive narrative from tom lee about eth's role as a store of value, especially in times of conflict, and its outperformance against traditional markets, strongly suggests upward price momentum.
#ETH
#ETHTreasury
#StoreOfValue
CoinDesk
2026-04-27
13:15
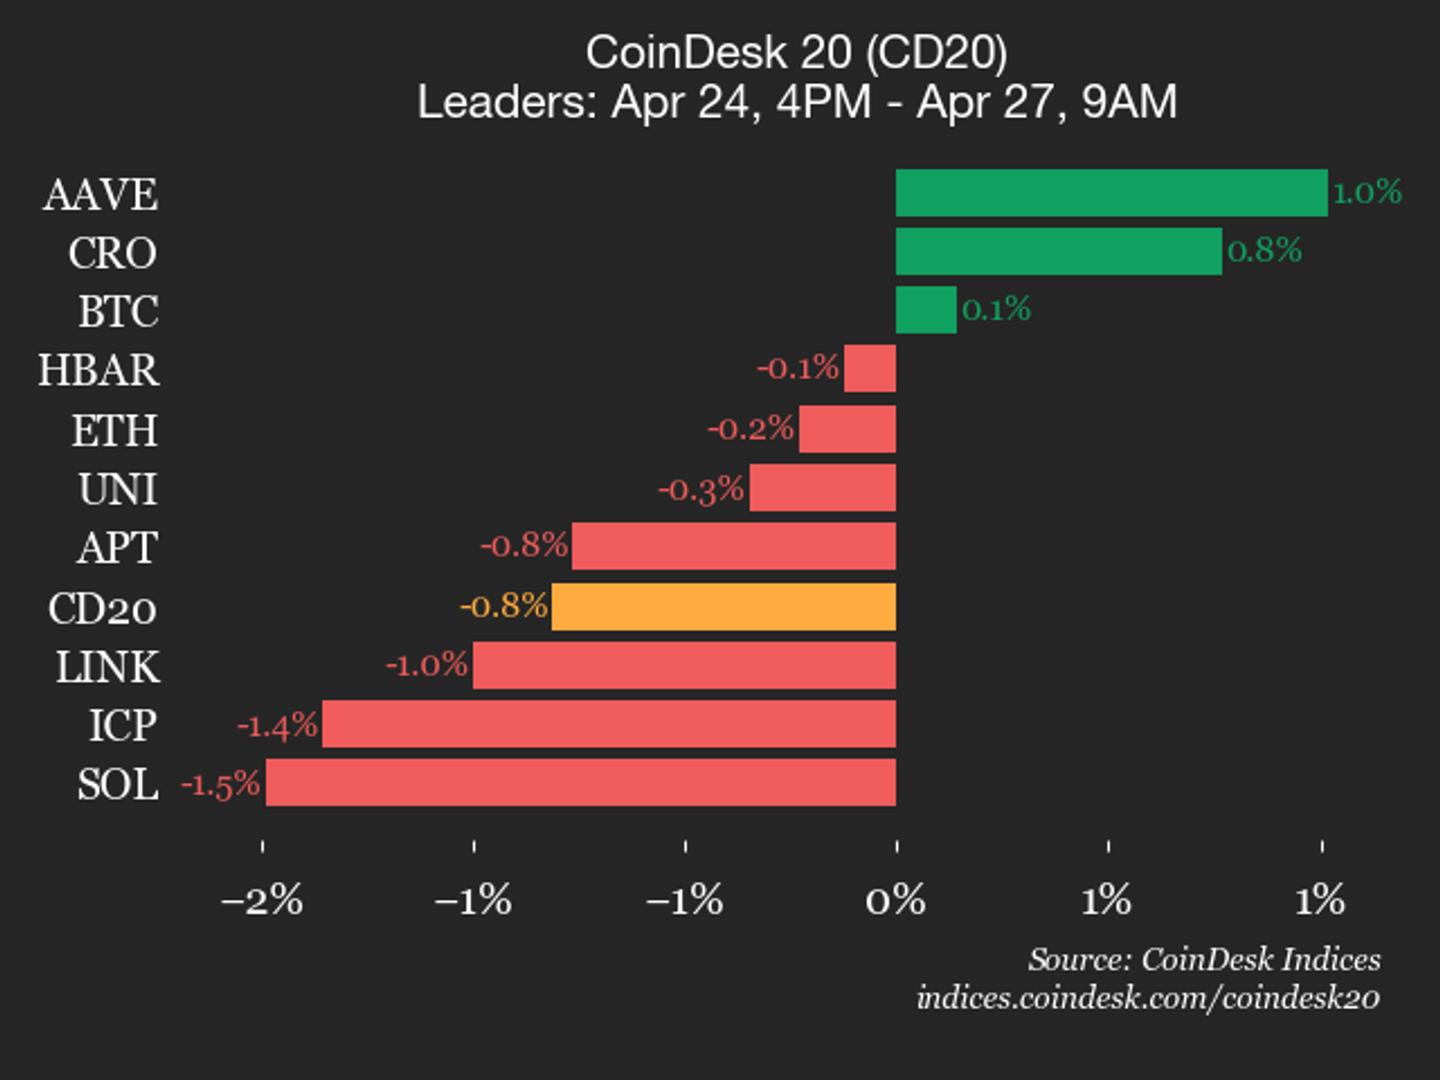
Med
Xlm's 3.4% drop is leading the coindesk 20 index lower, indicating a moderate negative impact on the broader market sentiment, though it's not a catastrophic drop.
High
Bearish
The article explicitly states xlm is 'leading index lower' and is among the 'laggards' with a significant percentage drop, directly pointing to a bearish price movement.
XLM
CoinDesk20
Bearish
UToday
2026-04-27
13:15
Low
This news is about security and scam warnings from ledger, a hardware wallet provider. while it doesn't directly impact the price of any specific cryptocurrency like xrp, it highlights a general risk in the crypto space. such scams can erode trust, but the impact on a specific coin's price is usually indirect and minor unless a major exchange or project is directly affected.
High
Neutral
The news is a security advisory and does not provide any fundamental or technical reasons to expect a price increase or decrease for xrp or any other cryptocurrency. it's a general alert about potential threats to crypto users.
#Ledger
#ScamAlert
#CryptoSecurity
UToday
2026-04-27
13:09
Low
While the burning of 1 billion shib is a positive development for the tokenomics, the article suggests that the overall market structure remains weak. the price is still in a downtrend, trading below key moving averages, and the recent recovery attempts are within a narrow ascending channel, indicating a controlled bounce rather than a trend reversal. low trading volume during upward movements further suggests a lack of strong buyer conviction.
Med
Neutral
The article suggests a likely scenario of continued shallow upward drift or sideways movement. while less selling pressure is noted, there isn't enough strong buying pressure indicated to signal a significant bullish reversal. a breakdown is still possible, especially if exchange inflows increase.
#SHIB
#ShibaInu
#Crypto
Decrypt
2026-04-27
13:08
Low
While the news involves a large sum of stolen cryptocurrency, it's an isolated incident of money laundering and not a systemic failure of a specific blockchain or protocol. the amount laundered by the individual is a small fraction of the total stolen. the news focuses on the criminal aspect rather than technological vulnerabilities, thus limiting direct price impact on major cryptocurrencies.
High
Neutral
This news pertains to illicit activities and law enforcement action. it does not directly signal any fundamental change in the value proposition or adoption of bitcoin or other major cryptocurrencies. such events are generally viewed as background noise by the market unless they become widespread or reveal critical security flaws.
#btc
#cryptocrime
#lawenforcement
Decrypt
2026-04-27
12:34
Med
While bitcoin etfs are seeing a consistent streak of inflows, the underlying spot demand is lagging. this suggests that the current rally might be driven by short liquidations and market-neutral strategies rather than genuine bullish conviction, indicating potential volatility.
Med
Neutral
The streak of etf inflows is positive, but the lack of strong spot demand and the influence of short squeezes create conflicting signals. this suggests a potential for both upward movement if shorts continue to unwind and downward correction if spot demand doesn't materialize.
#btc
#crypto
#etf

NewsBTC
2026-04-27
12:30
High
The article describes a bearish pattern analyzed by a crypto analyst, suggesting a potential crash for dogecoin. this, coupled with a descending resistance trendline and bearish market momentum, indicates a significant downside risk.
Med
Bearish
The analyst predicts a 'dogecoin trap' and a likely crash to around $0.08917, citing a bearish volume spread analysis pattern and a descending resistance trendline that dogecoin has failed to break.
DOGE
Crypto
Bearish

Cointelegraph
2026-04-27
12:11

CoinDesk
2026-04-27
12:11